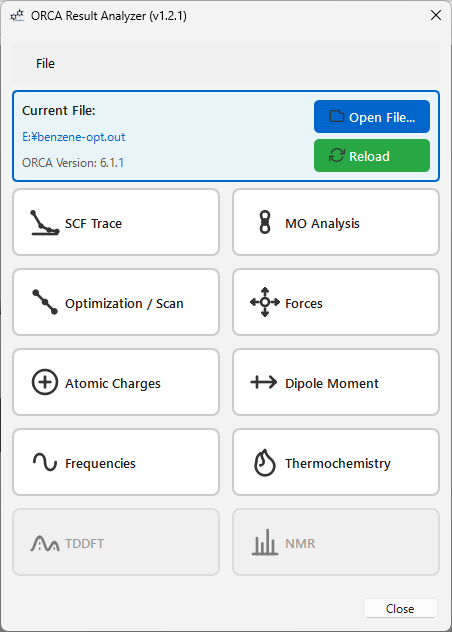
moleditpy_orca_result_analyzer_plugin
MoleditPy ORCA Result Analyzer Plugin
A comprehensive plugin for MoleditPy to analyze and visualize results from ORCA quantum chemistry calculations.
Repo: https://github.com/HiroYokoyama/moleditpy_orca_result_analyzer_plugin
Features
1. SCF Trace
Real-time convergence visualization for SCF energy cycles.
- Concatenated View: View a single continuous plot of all SCF cycles throughout the calculation.
- Interactive Tools: Full zoom, pan, and save support via an integrated Matplotlib toolbar.
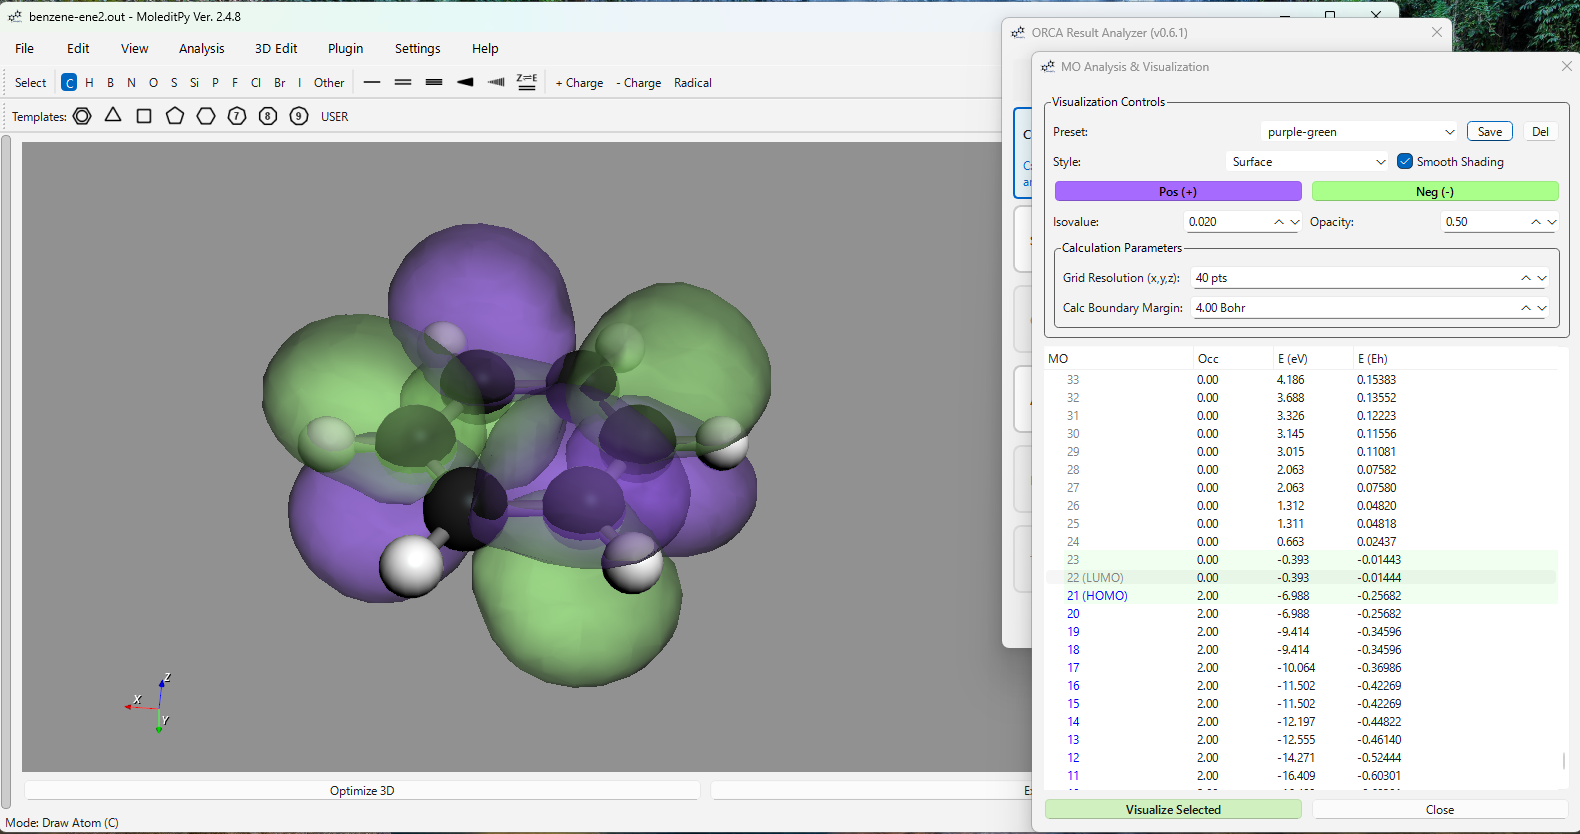
2. MO Analysis
- Levels: View orbital energies and occupancy with HOMO/LUMO identification.
- Visualization: Generate 3D Cubes (isosurfaces) with Smooth Shading and adjustable opacity.
- Presets: Save and manage visualization presets (colors, isovalues, styles).
- Advanced Support: Successfully handles S, P, D, F, and G shells (L=4).
- Feedback: Integrated warning system identifies missing ORCA output keywords required for cube generation.
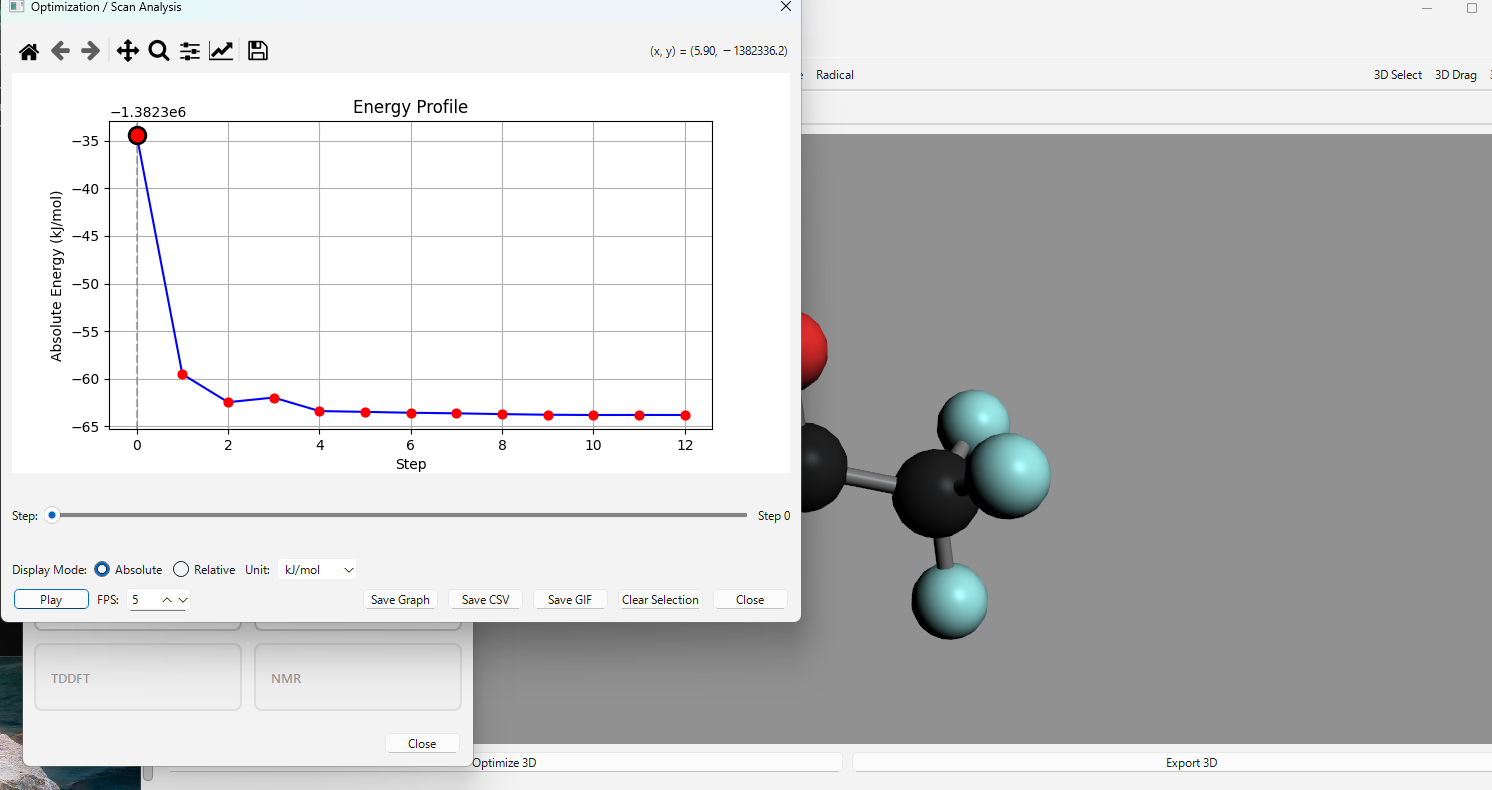
3. Optimization / Scan
Analyze Geometry Optimizations and Relaxed Surface Scans.
- Interactive Graph: Plot Energy vs. Step. Click points to update the 3D structure.
- Display Modes: Toggle between Absolute and Relative energy (kJ/mol, kcal/mol, eV, Eh).
- Log Scale: Supports log-scale visualization for relative energy changes.
- Animation: Play/Pause trajectory animations with adjustable FPS.
- Export: Save plots as images or export the full 3D animation as high-quality GIFs.
4. Forces
Analyze structural forces for the current structure or the entire trajectory.
- Historical Gradients: Capture and display force vectors for every step of an optimization or scan.
- Visualization Controls: Auto Scale feature automatically optimizes vector size for visibility, especially for small gradients.
- Step-by-Step Navigation: Precise control with
<and>buttons or the trajectory slider. - Convergence Tracking: Multi-line display of RMS/MAX Gradient and RMS/MAX Step, color-coded (Green for YES, Red for NO).
- Data Table: Full breakdown of gradients, force components, and magnitudes.
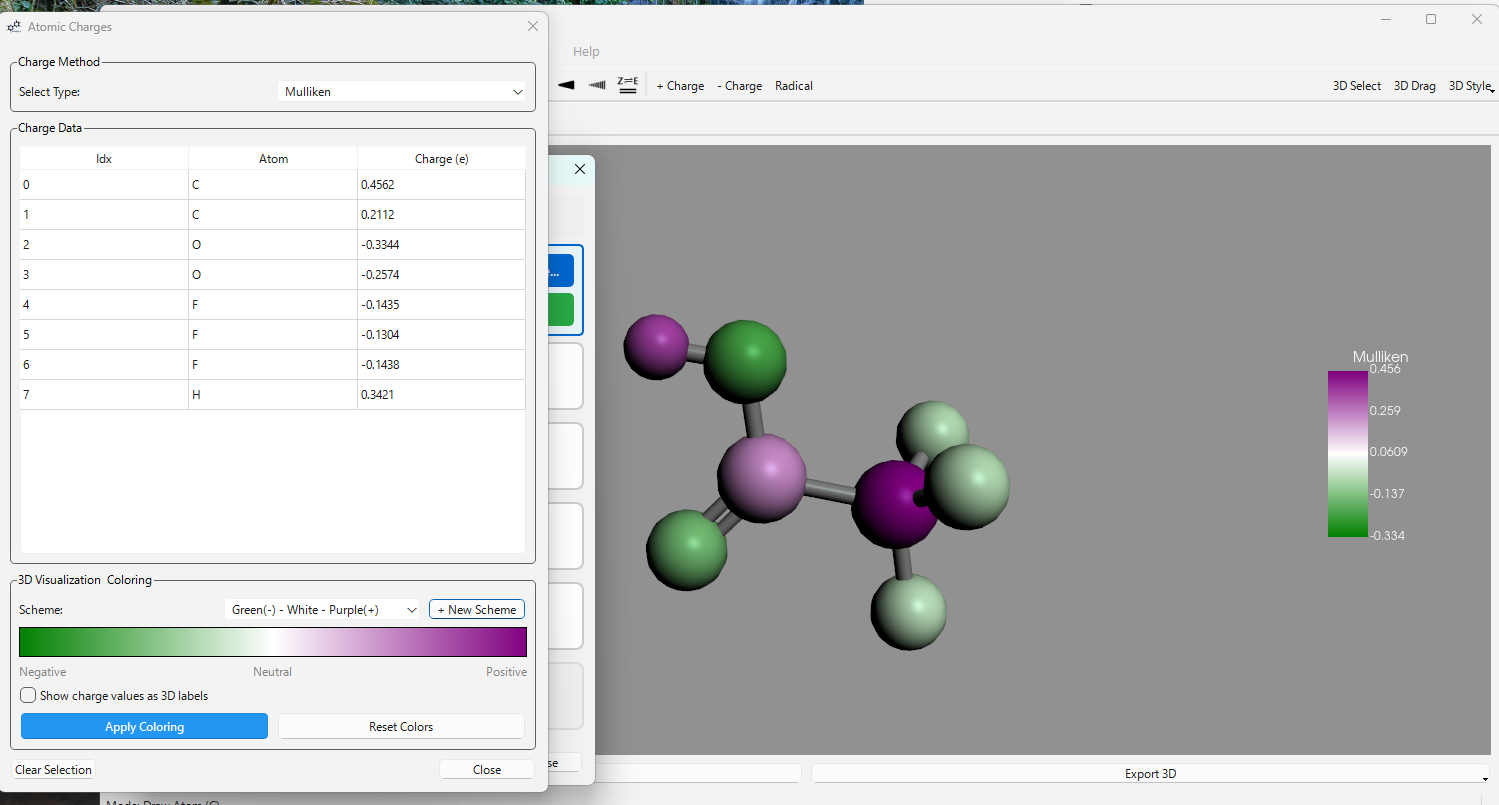
5. Atomic Charges
- Populations: Mulliken, Loewdin, Hirshfeld, and NBO populations (if available).
- 3D Coloring: Color atoms in the 3D viewer based on charge value or population type.
6. Dipole Moment
- Vector Visualization: Display the total dipole moment vector magnitude and direction in the 3D viewer.
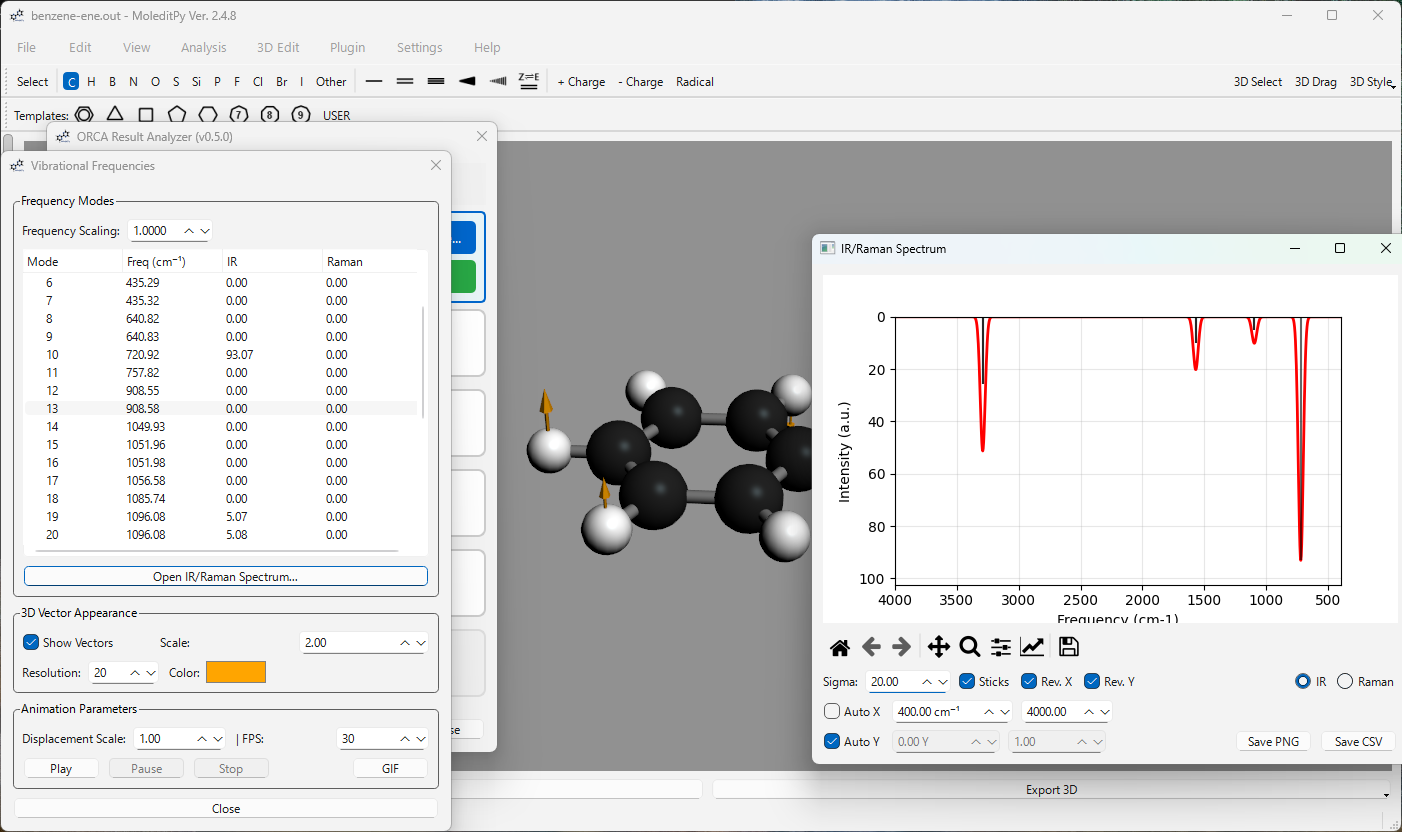
7. Frequencies
Visualize vibrational modes and spectra.
- IR/Raman: Stick and broadened spectra plots with interactive peak labels.
- Visualization: Animated vibrational modes with vector arrows.
8. Thermochemistry
Detailed analysis of thermodynamic properties based on frequency calculations.
- Broad Summary: Electronic Energy, ZPE, Enthalpy (H), Gibbs Free Energy (G).
- Detailed Corrections: Optional breakdown of vibrational, rotational, and translational contributions to energy and entropy.
9. TDDFT
Analyze electronic excitations and absorption spectra.
- Spectra: Absorption and CD (Circular Dichroism) spectra with Gaussian broadening.
- Controls: Adjustable broadening (Sigma) and peak-stick overlays.
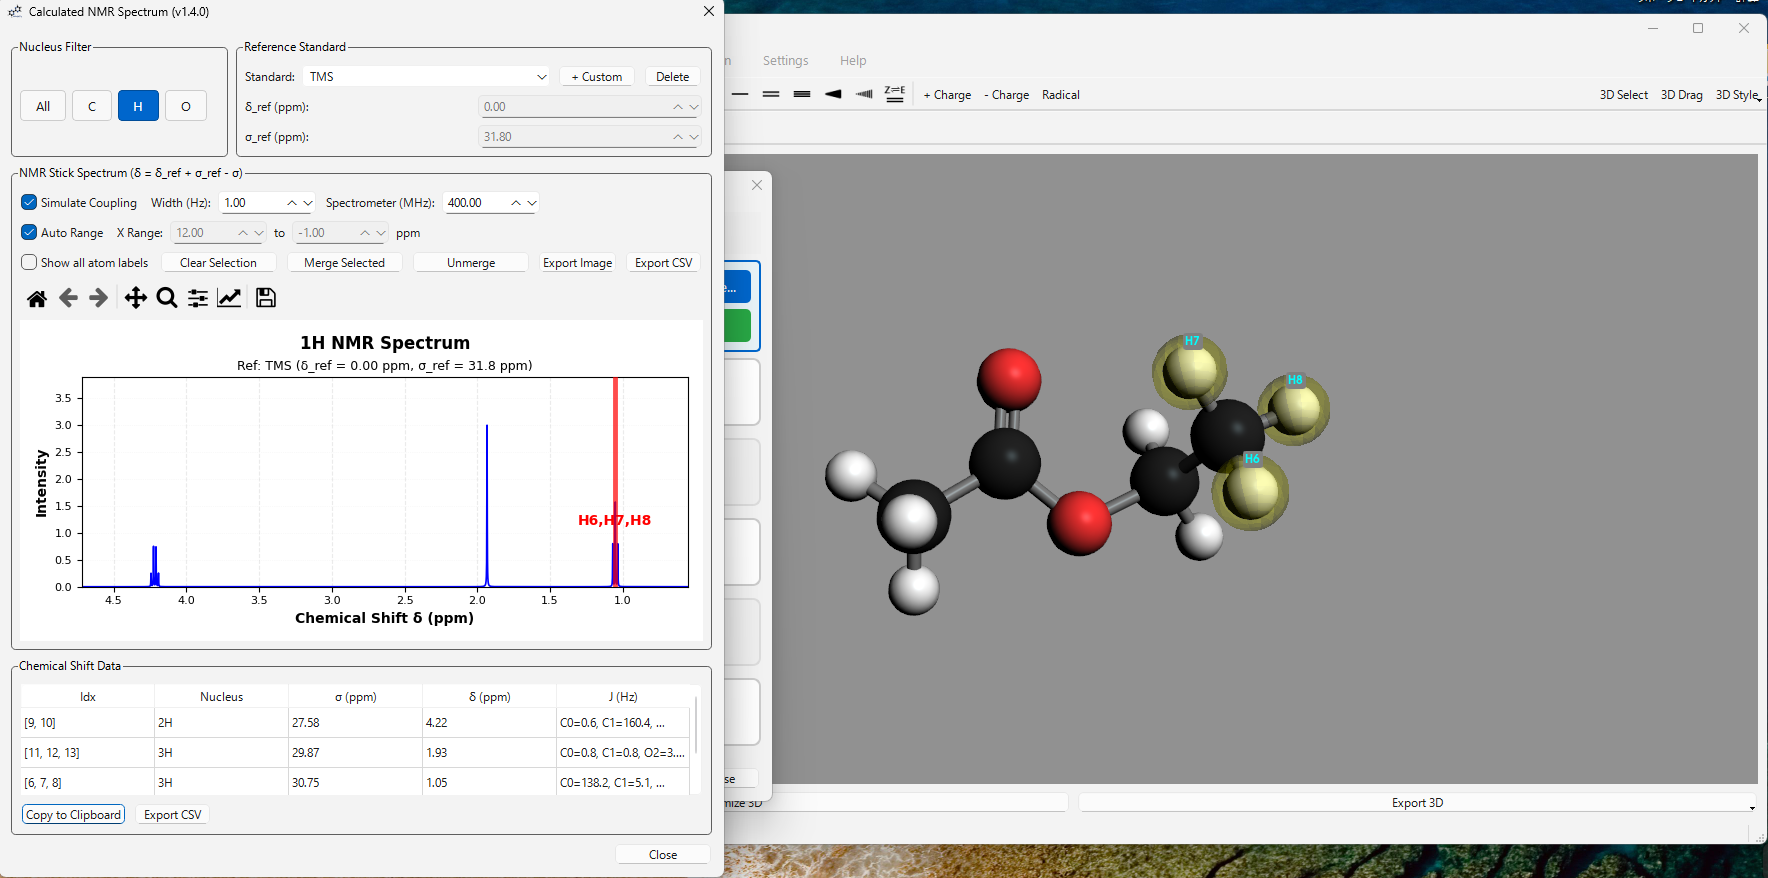
10. NMR
Advanced NMR chemical shielding validation and visualization.
- Stick Spectrum: Nucleus-specific stick spectra (1H, 13C, etc.) with experimental reference standards (TMS, CDCl3, DMSO-d6, etc.).
- Multiplet Simulation: Realistic J-coupling splitting patterns and first-order multiplicity calculations with adjustable Lorentzian line-widths.
- Custom References: Add and manage custom reference standards (delta_ref and sigma_ref).
- Equivalent Atom Merging: Manually merge equivalent atoms into single peaks with persistent storage.
- Interactive Sync: Robust bidirectional synchronization—selecting peaks in the spectrum highlights atoms in 3D (and vice-versa).
Interface & Usability
- Logical Workflow: Buttons grouped by task: Electronic -> Geometry -> Properties -> Spectroscopy.
- Modeless Design: All analysis windows are modeless, allowing side-by-side comparison and 3D viewer interaction.
- Keyboard Shortcuts:
Ctrl+O(Open),Ctrl+R(Reload),Ctrl+W(Close Window). - Persistence: Remembers your presets, NMR references, and merged peaks across sessions.
Installation
Download from Plugin Explorer.
Ensure the orca_result_analyzer folder is placed in your MoleditPy plugins directory.
Requirements
- ORCA Output: Reads
.outor.logfiles. Basis set info (Print[P_Basis] 2) is required for MO Cube generation. - Dependencies:
rdkit,matplotlib,Pillow(PIL), andpyvista(for 3D vectors).nmrsimis optional (for J-coupling simulation).
License Note on Sample Output Files
The test fixtures in tests/sample_outputs/ are ORCA quantum chemistry output files (.out) generated by running ORCA on publicly available molecular geometries (benzene, acetone).
ORCA is proprietary software distributed free for academic use under its own license. These output files are included solely as test fixtures for the parser. They are excluded from this project’s GPL-3.0 license — they are not source code of this project and carry no additional redistribution grant beyond what the general scientific community norm considers acceptable for test data.
If you need to regenerate these files, you will need your own ORCA installation.
Required ORCA Keywords
For MO Cube Generation:
Note: Standard output is usually sufficient for Geometry and Energies, but Basis Set information is strictly required for generating cubes.
%output
  Print[P_Basis] 2  # Required for Basis Set parsing
  Print[P_Mos] 1    # Ensure MO coefficients are printed
end
For NMR Simulation (J-Coupling):
! NMR

%eprnmr
  NUCLEI = ALL H {SHIFT, SSALL} # Required for J-coupling (nmrsim)
end