MoleditPy PySCF Calculator Plugin Tutorial
1. Butadiene Molecular Orbitals & Nodal Rules
(Calculation Level: B3LYP/STO-3G)
Objective
Visualize the π-electron system molecular orbitals of 1,3-butadiene and verify the regularity that the number of "Nodes" increases as the energy level rises.
Instructions
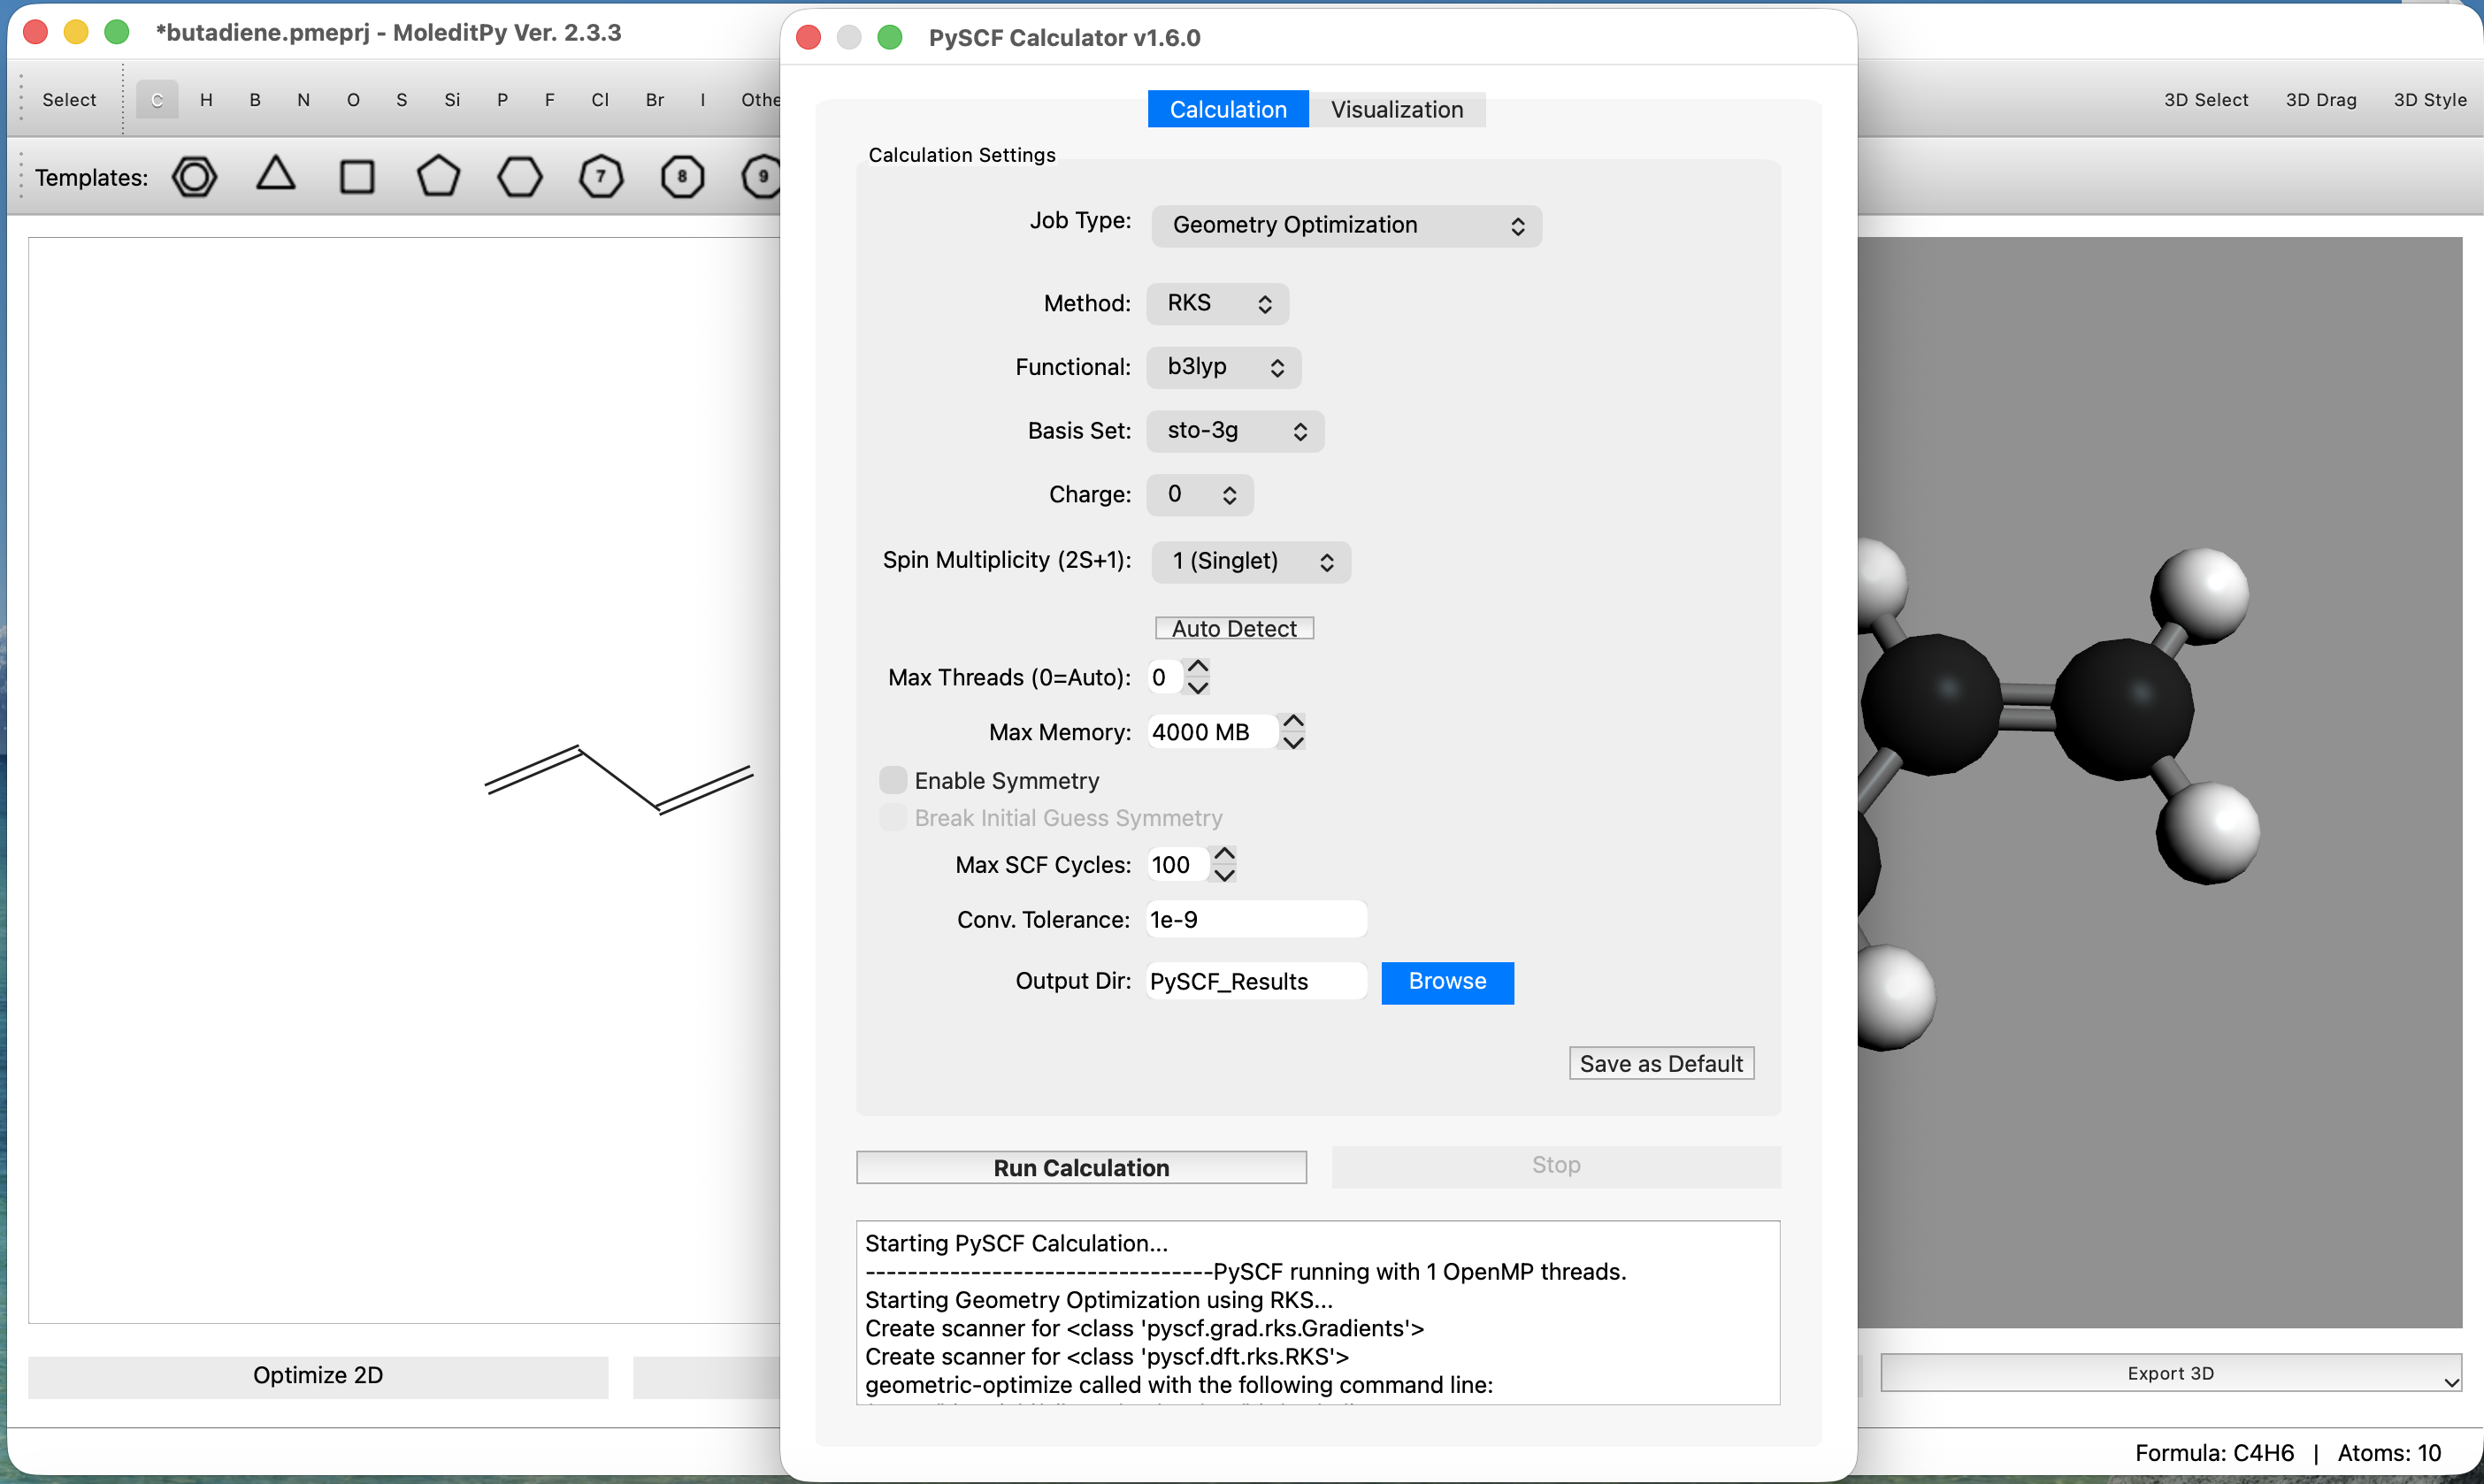
Step 1: Build Molecular Model & Run Calculation
- Draw the Structure:
- On the main 2D canvas, select the Carbon tool.
- Draw a chain of 4 Carbon atoms.
- Create Double Bond: Draw a single bond to an Oxygen atom first. Then, hover over the bond and press '2' (or select the "Double Bond" tool and click the bond) to convert it to a C=C double bond.
- Ensure the structure represents 1,3-Butadiene.
- Convert to 3D: Locate the toolbar and click the "Convert 2D to 3D" button.
- Wait for the 3D structure to generate.
- Launch Plugin:
- Go to the menu bar:
Extensions>PySCF Calculator. - This will open the PySCF Calculator interface.
- Go to the menu bar:
- Configure Calculation:
- Navigate to the
Calculationtab. - Set Job Type to
Geometry Optimization. - Set Method to
RKS(Restricted Kohn-Sham). - Set Functional to
b3lyp. - Set Basis to
sto-3g(Minimal basis set for speed). - Click the
Run Calculationbutton to start the calculation.
- Navigate to the
Step 2: Generate Orbital Data (Post-Calculation Analysis)
Wait for the calculation to finish. The status bar will indicate completion, and the
Post-Calculation Analysis area at the bottom will become active.
- Select Orbitals:
- Scroll through the orbital list in the analysis panel.
- Check the boxes for HOMO-1, HOMO (Highest Occupied Molecular Orbital), LUMO (Lowest Unoccupied Molecular Orbital), and LUMO+1.
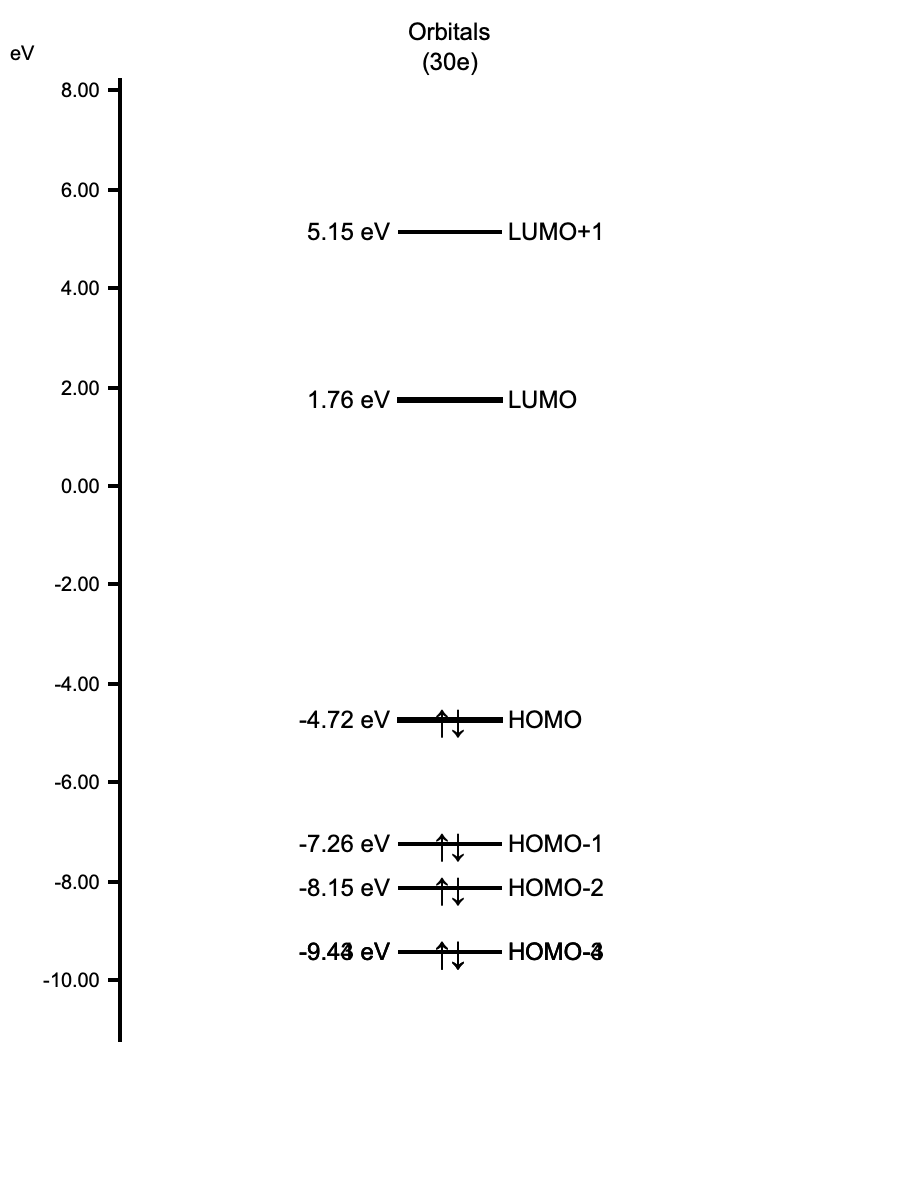
Pro Tip: Click the Orbital Energy Diagram button to open an interactive dialog. This is useful for checking energy gaps (HOMO-LUMO gap) and selecting orbitals directly from the diagram.
- Generate Cubes:
- Click the
Generate & Visualize Selectedbutton. - Note: The application will calculate the orbital values on a grid and save them as
.cubefiles. This may take a few seconds.
- Click the
- Verify Output: check that new files with a
.cubeextension appear in theVisualization Fileslist.
Step 3: Compare Orbitals
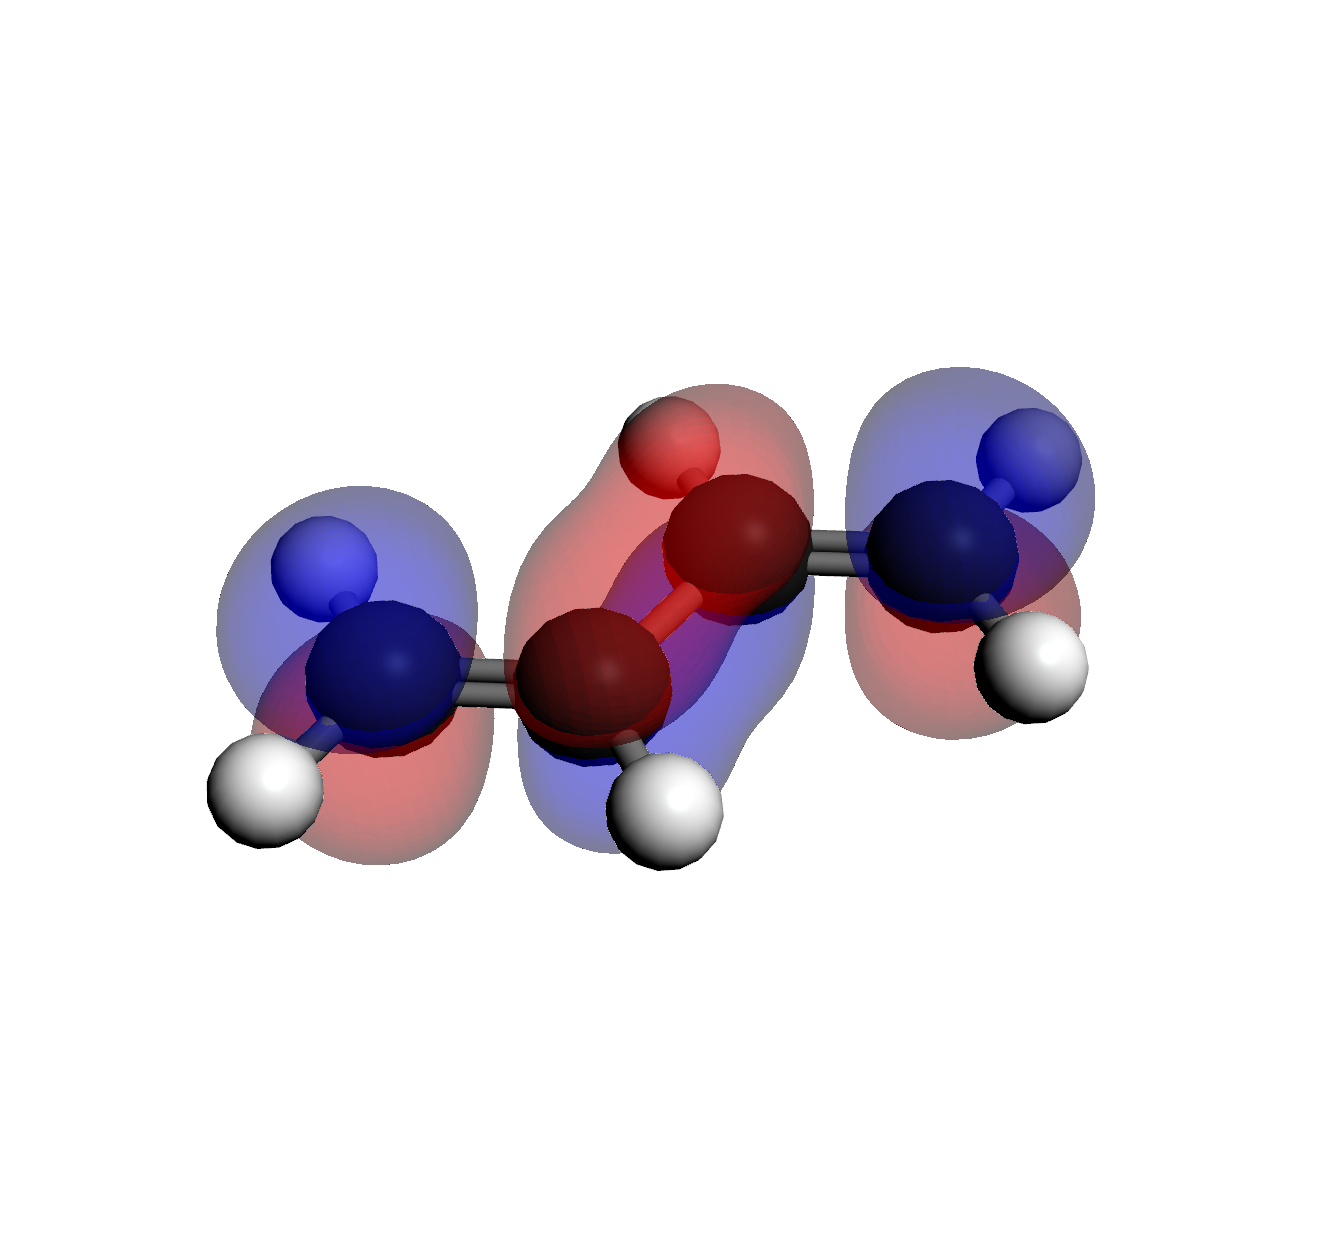
Select each file from the Visualization Files list to view the shape. Notice how the number
of "nodes" (change in phase/color) increases with energy.
 1. HOMO-1 (Orb 14)
0 Nodes (Lowest Energy)
1. HOMO-1 (Orb 14)
0 Nodes (Lowest Energy)
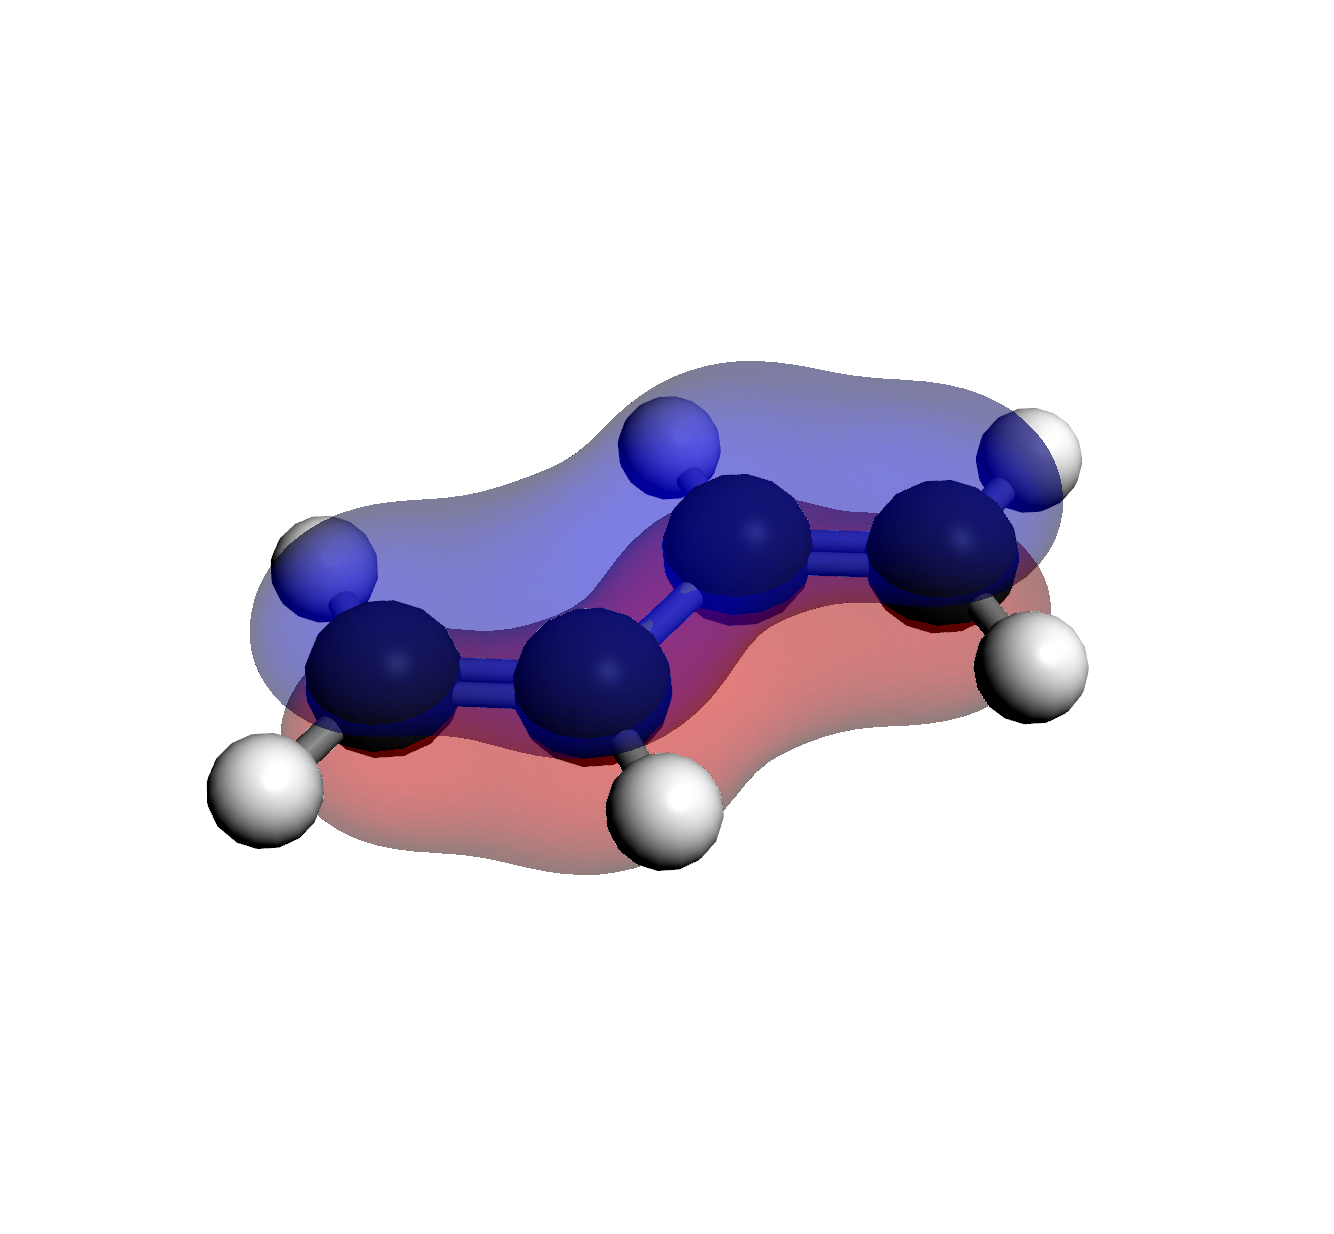
 2. HOMO (Orb 15)
1 Node
2. HOMO (Orb 15)
1 Node
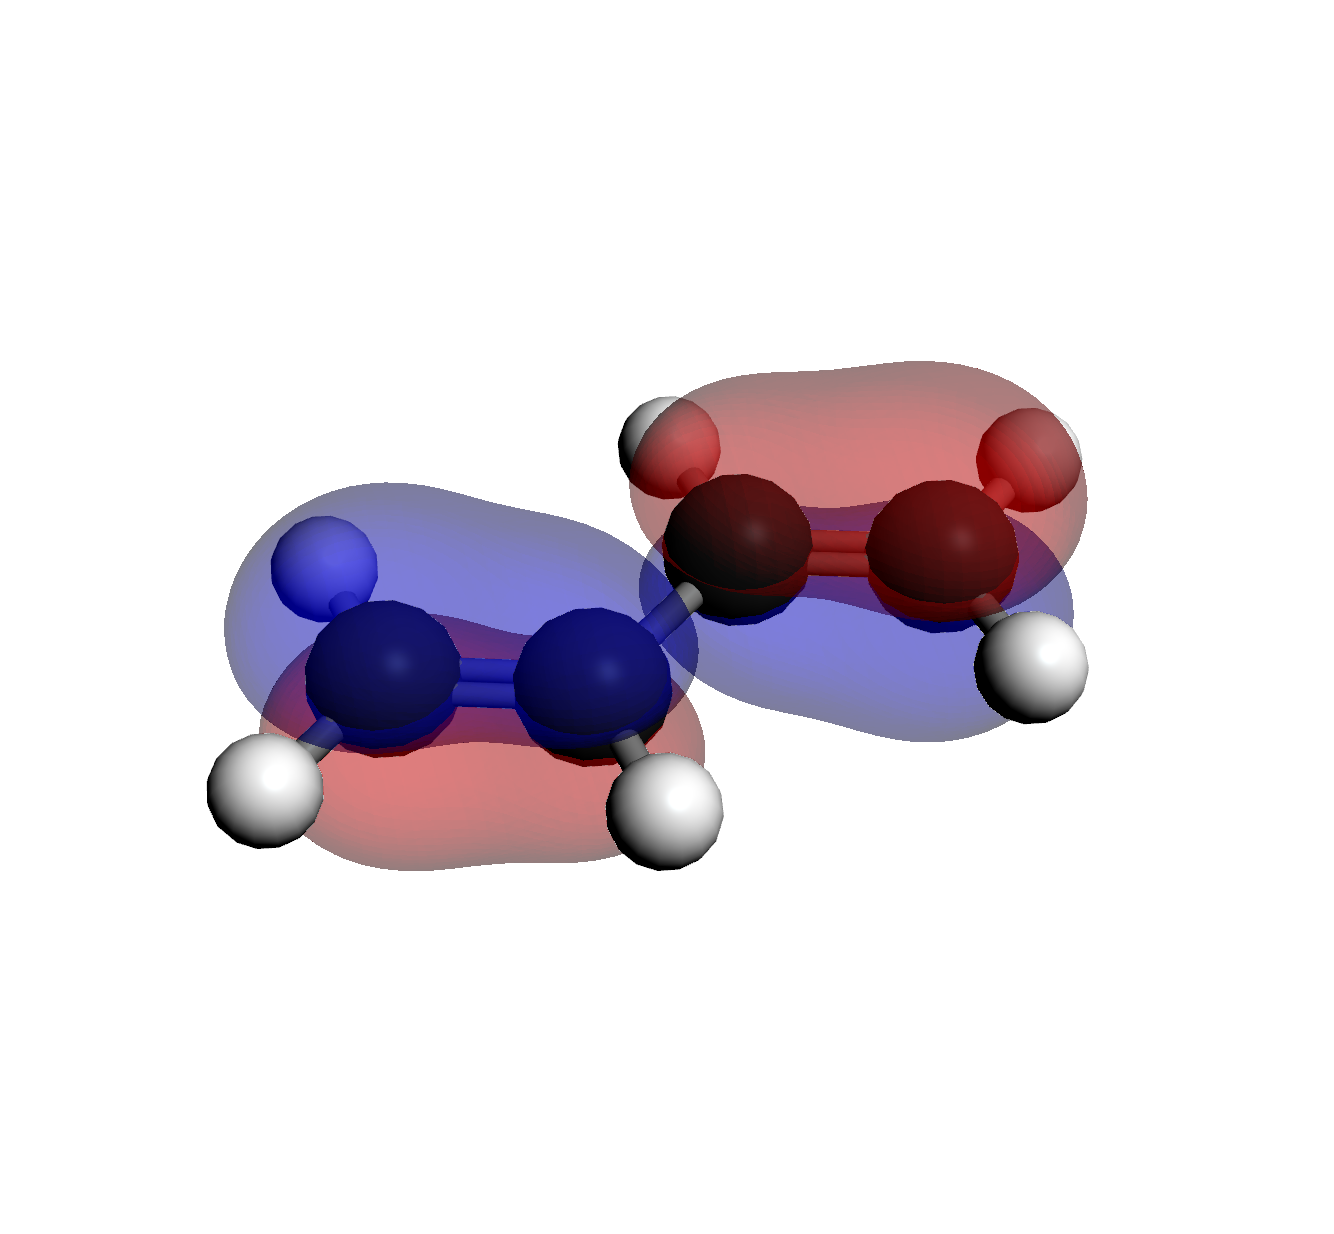
 3. LUMO (Orb 16)
2 Nodes
3. LUMO (Orb 16)
2 Nodes
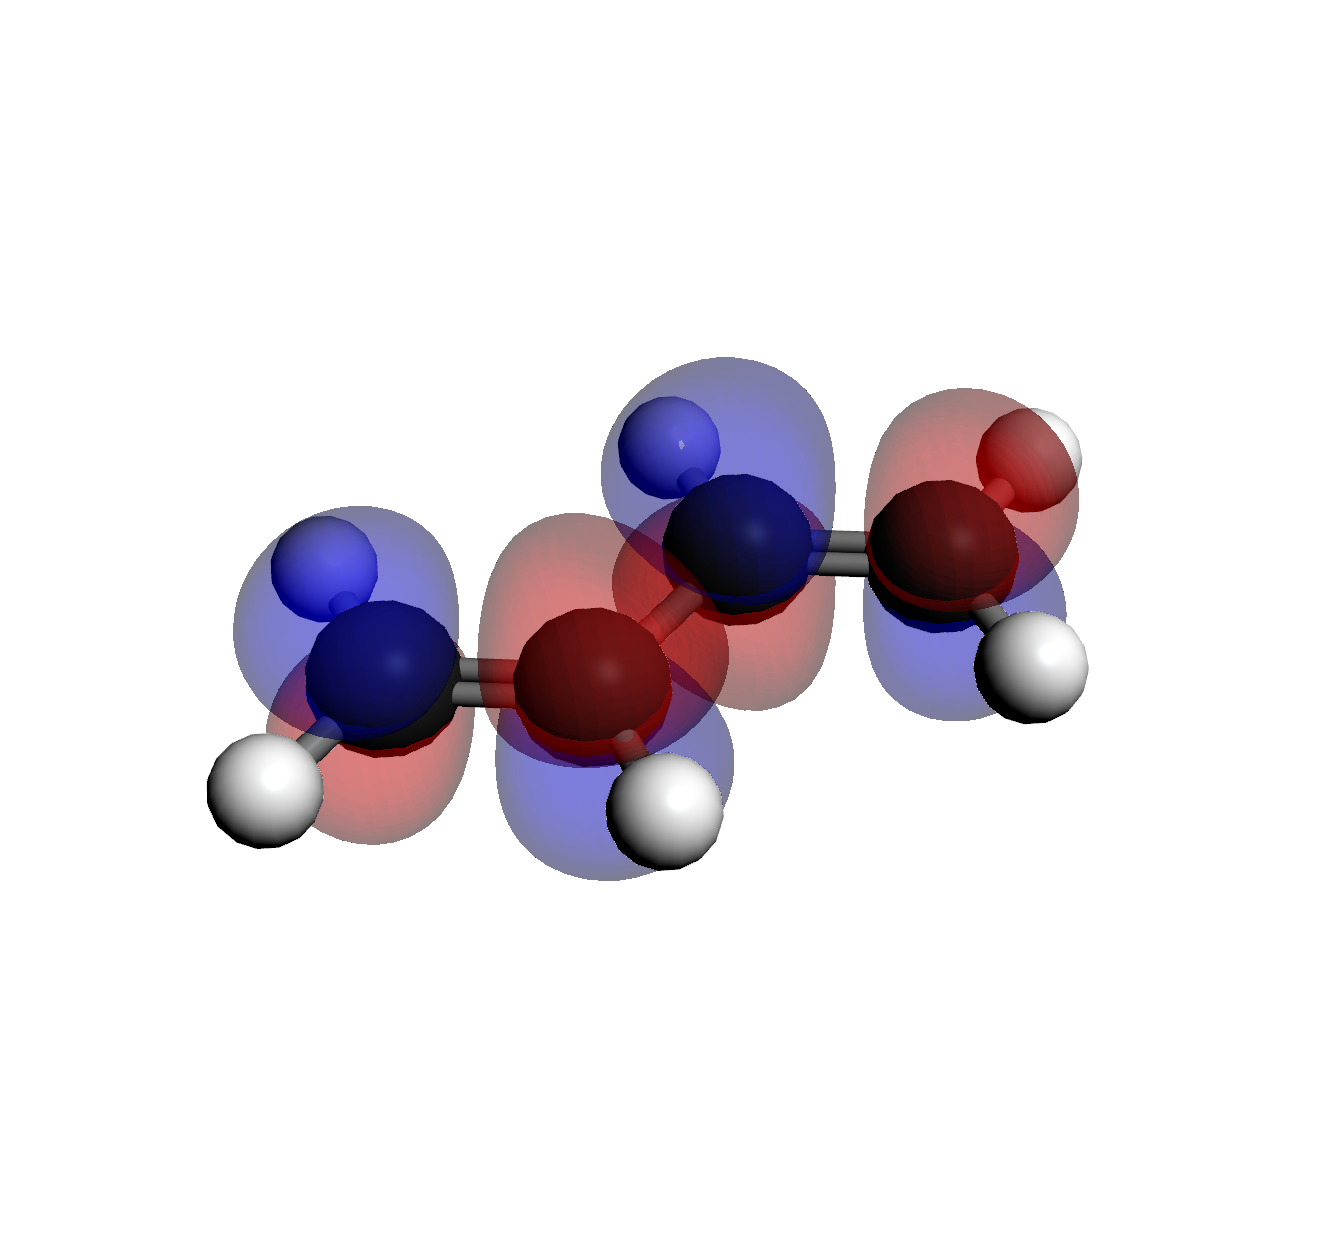 4. LUMO+1 (Orb 17)
3 Nodes (Highest Energy)
4. LUMO+1 (Orb 17)
3 Nodes (Highest Energy)
Tip: If you need to restart, select File > New from the menu
bar to reset the canvas.