MoleditPy PySCF Calculator Plugin Tutorial
3. Ethane Internal Rotation & Scan
(Calculation Level: B3LYP/STO-3G)
Objective
Scan the Potential Energy Surface (PES) by rotating the C-C single bond of an ethane molecule to observe the correlation between energy changes and molecular structure. The rotational barrier is experimentally known to be approximately 12 kJ/mol.
Instructions
Step 1: Build Molecular Model
- Draw Ethane:
- On the main canvas, draw a 2-carbon chain (C-C).
- The tool implies hydrogen saturation, so this represents Ethane (C2H6).
- Convert and Launch:
- Click "Convert 2D to 3D" to generate the 3D model.
- Go to
Extensions>PySCF Calculatorto open the plugin.
Step 2: Scan Settings & Execution
- Select Job Type:
- In the
Calculationtab, set Job Type toRelaxed Surface Scan. - Set Method to
RKS/ Functional tob3lyp/ Basis tosto-3g. - This tells the solver to optimize the geometry at each step of the scan.
- In the
- Configure Scan Variables:
- Click the
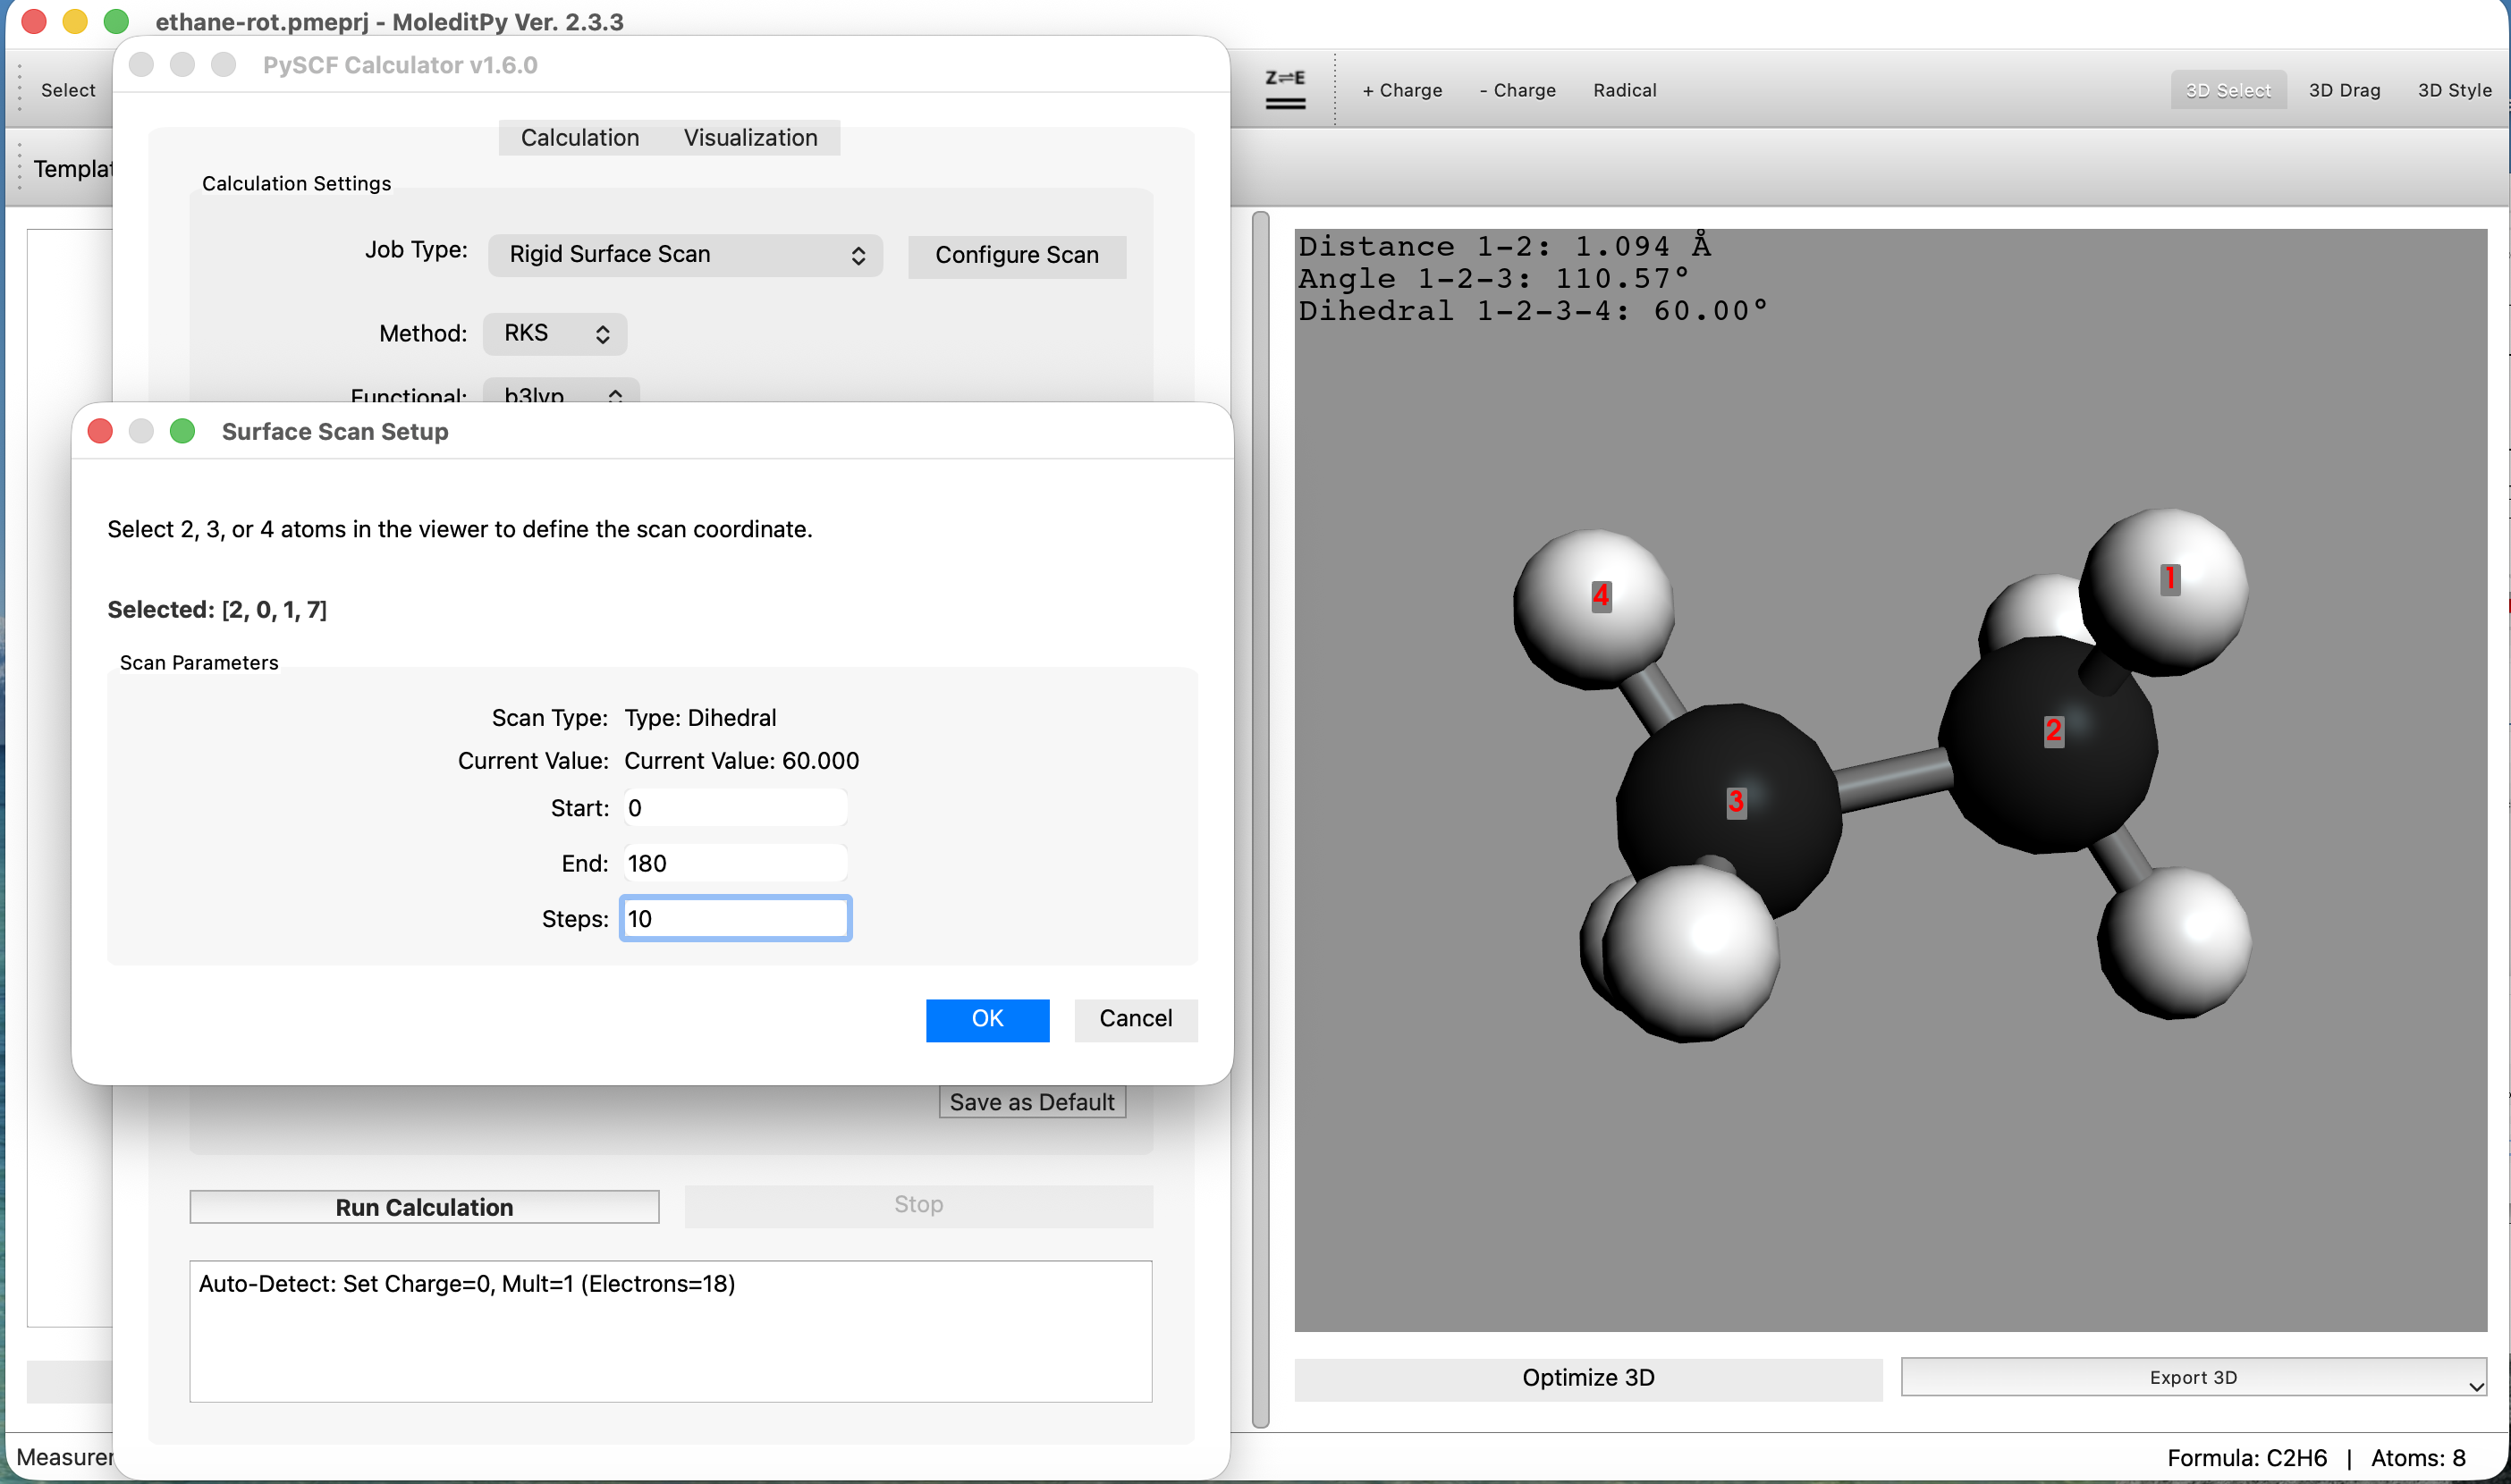
Configure Scanbutton. - Action: The application enters "Surface Scan Setup" mode.
- Click the
- Define Dihedral Angle:
- Return to the Main 3D Viewport.
- Select 4 atoms in sequence to define the dihedral angle: Hydrogen → Carbon → Carbon → Hydrogen.
- Verify the selected atoms form the torsional angle you wish to rotate.
- Set Parameters and Run:
- A dialog will appear showing the current angle.
- Set Start to
0. - Set End to
180. - Set Steps to
10. - Click
OKto confirm, then clickRun Calculationon the main tab.
Step 3: Play Results Animation
Wait for the entire scan to complete. A Scan Results window will pop up automatically.
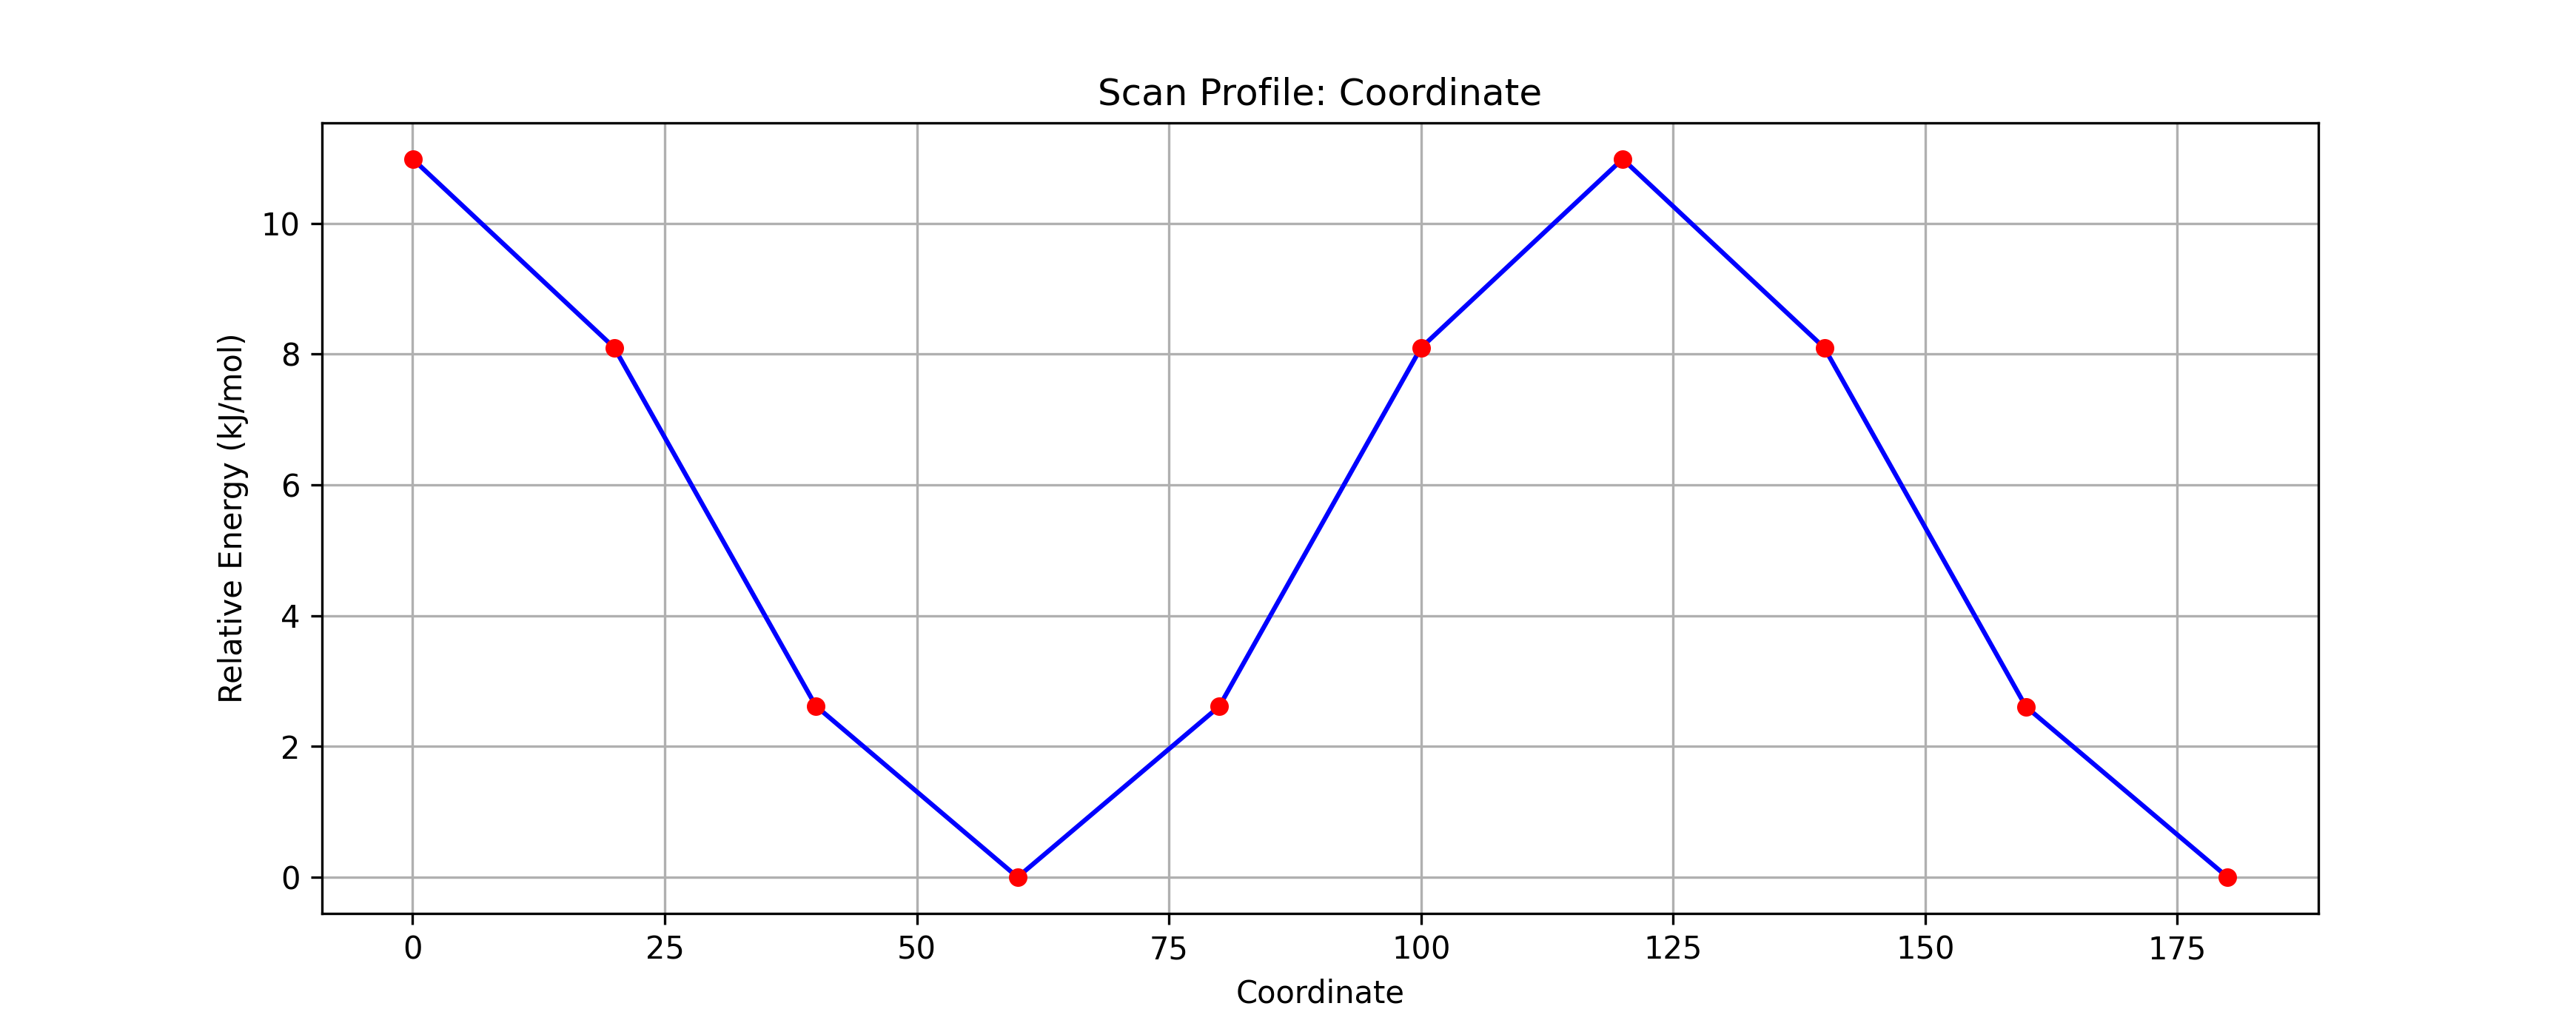
- Analyze the Graph:
- Observe the potential energy curve displayed in the window.
- Identify the Maxima (peaks) at 0° and 120°. These correspond to the unstable Eclipsed conformations.
- Identify the Minima (valleys) at 60° and 180°. These correspond to the stable Staggered conformations.
- Verify that the calculated energy barrier is approximately 12 kJ/mol, closer to the experimental value.
- Visualize Rotation:
- Click the
Playbutton (or scrub the timeline slider) in the results window. - Watch the 3D molecule in the main view. It should rotate its C-C bond in sync with the graph, demonstrating the conformational changes.
- Click the