MoleditPy PySCF Calculator Plugin Tutorial
2. Acetone ESP Mapping & Polarization
(Calculation Level: B3LYP/STO-3G)
Objective
Map the charge distribution (Electrostatic Potential) on the surface of an acetone molecule to identify the polarity of the carbonyl group and reactive sites.
Instructions
Step 1: Build Molecular Model & Run Calculation
- Draw Acetone:
- Select the drawing tool.
- Draw a 3-carbon chain (C-C-C).
- Add an Oxygen atom to the central carbon (click and drag with Oxygen tool).
- Create Double Bond: Hover over the C-O bond and press '2' to convert it to a double bond (or use the "Double Bond" tool).
- Ensure the structure is Acetone (CH3COCH3).
- Setup Calculation:
- Convert
2D to 3D. - Open
Extensions>PySCF Calculator. - In the
Calculationtab, set Job Type toGeometry Optimization. (Optimizing the geometry ensures an accurate ESP map). - Set Method to
RKS/ Functionalb3lyp/ Basissto-3g. - Click
Run Calculation.
- Convert
Step 2: Generate ESP Data
Wait for the optimization to complete.
- Select Analysis:
- In the
Post-Calculation Analysissection, locate the Analysis Type list. - Check the box labeled
ESP (Electrostatic Potential + Density).
- In the
- Generate Map:
- Click
Generate & Visualize Selected. - Note: The plugin will calculate the electron density grid and map the electrostatic potential onto an isosurface of that density. This process is computationally intensive and might take longer than orbital generation.
- Click
Step 3: Visualize Charge Distribution
The ESP map should load automatically. If not, click the file in Visualization Files.
- Adjust Visualization:
- Use the
Visualization Controlspanel. - Adjust the Isovalue slider to change the density surface level (usually around 0.002 - 0.02 a.u.).
- Lower the Opacity slider (e.g., to 0.6) so you can see the molecular skeleton inside the surface.
- Use the
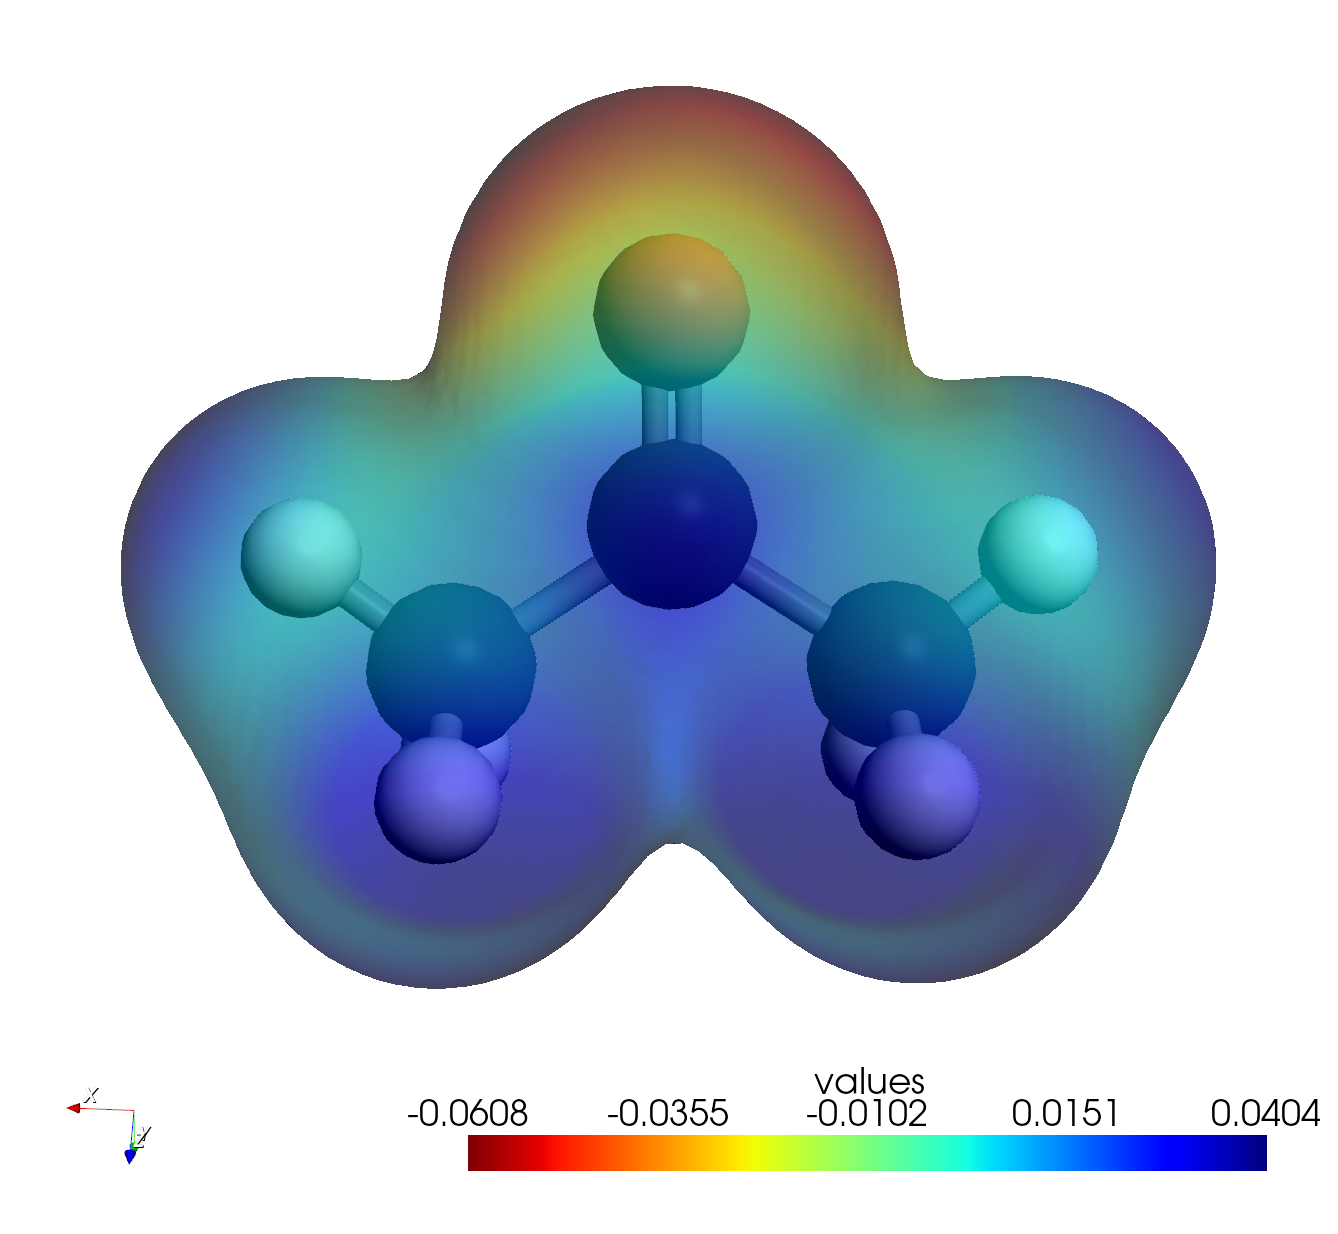
- Interpret the Map:
- Red Areas: Indicate negative potential (high electron density). You should see this concentrated around the Oxygen atom (lone pairs).
- Blue Areas: Indicate positive potential (low electron density). You should see this around the Hydrogen atoms.
- This confirms the polarity of the carbonyl group and predicts that electrophiles will attack the Oxygen, while nucleophiles attack the Carbonyl Carbon.
- Note: The unit of the Electrostatic Potential is Hartree.
Notes
- Basis Set: This tutorial uses
STO-3Gfor speed. - Troubleshooting: If you make a mistake, it is recommended to select
File > Newand restart from the beginning rather than trying to fix it manually.