MoleditPy PySCF Calculator Plugin Tutorial
4. Scanning SN2 Reaction and Finding Transition State
(Level of Theory: B3LYP/ma-def2-svp)
Objective
Using the SN2 substitution reaction between chloromethane (CH3Cl) and bromide ion (Br-) as an example, we will perform a reaction coordinate scan (Relaxed Scan) to estimate the energy barrier. Furthermore, using that structure as an initial guess, we will perform a Transition State (TS) calculation and frequency analysis to confirm the imaginary frequency.
Procedure
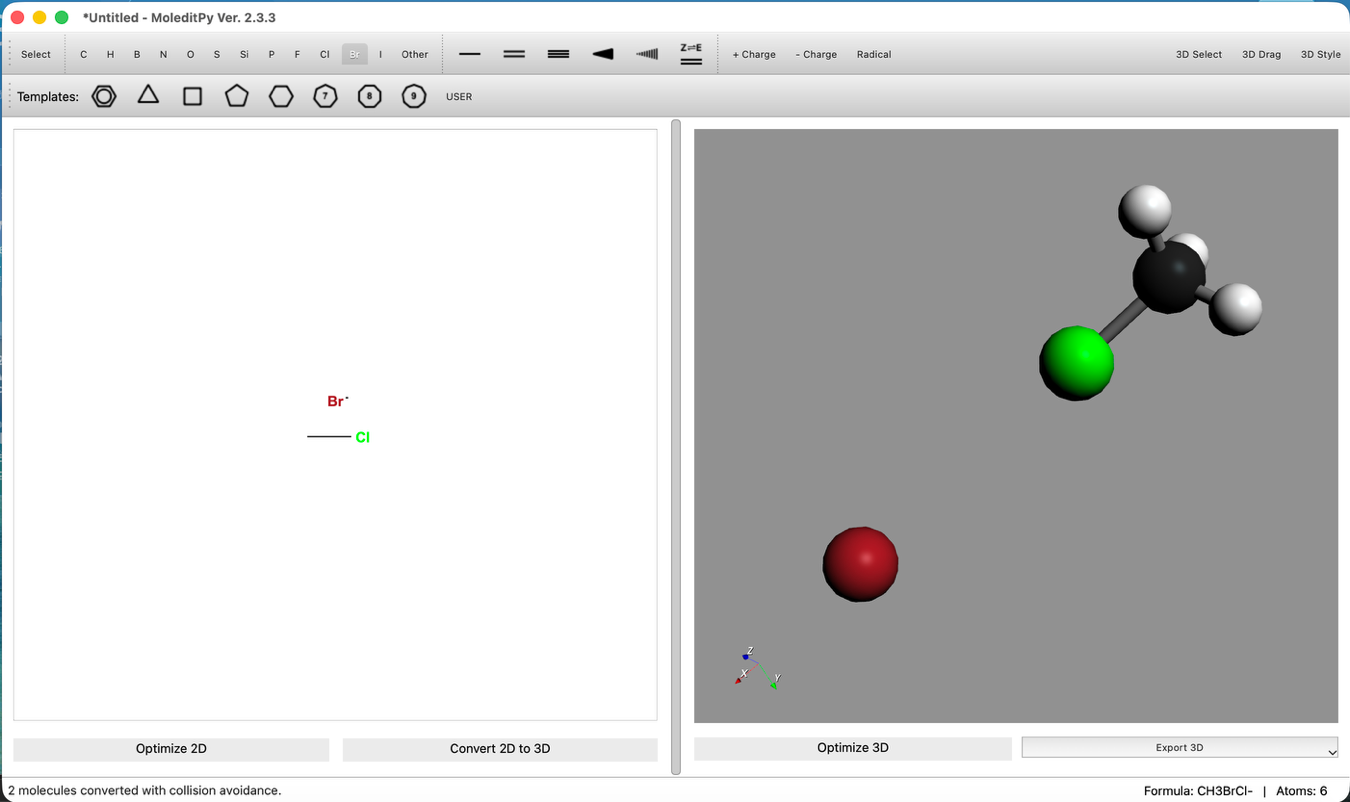
Step 1: Drawing and Arranging Molecules
- Draw Molecules:
- Draw Chloromethane (CH3Cl).
- Draw a Bromide ion (Br-) nearby.
- 3D Conversion:
- Click "Convert 2D to 3D" on the toolbar to convert to a 3D structure.
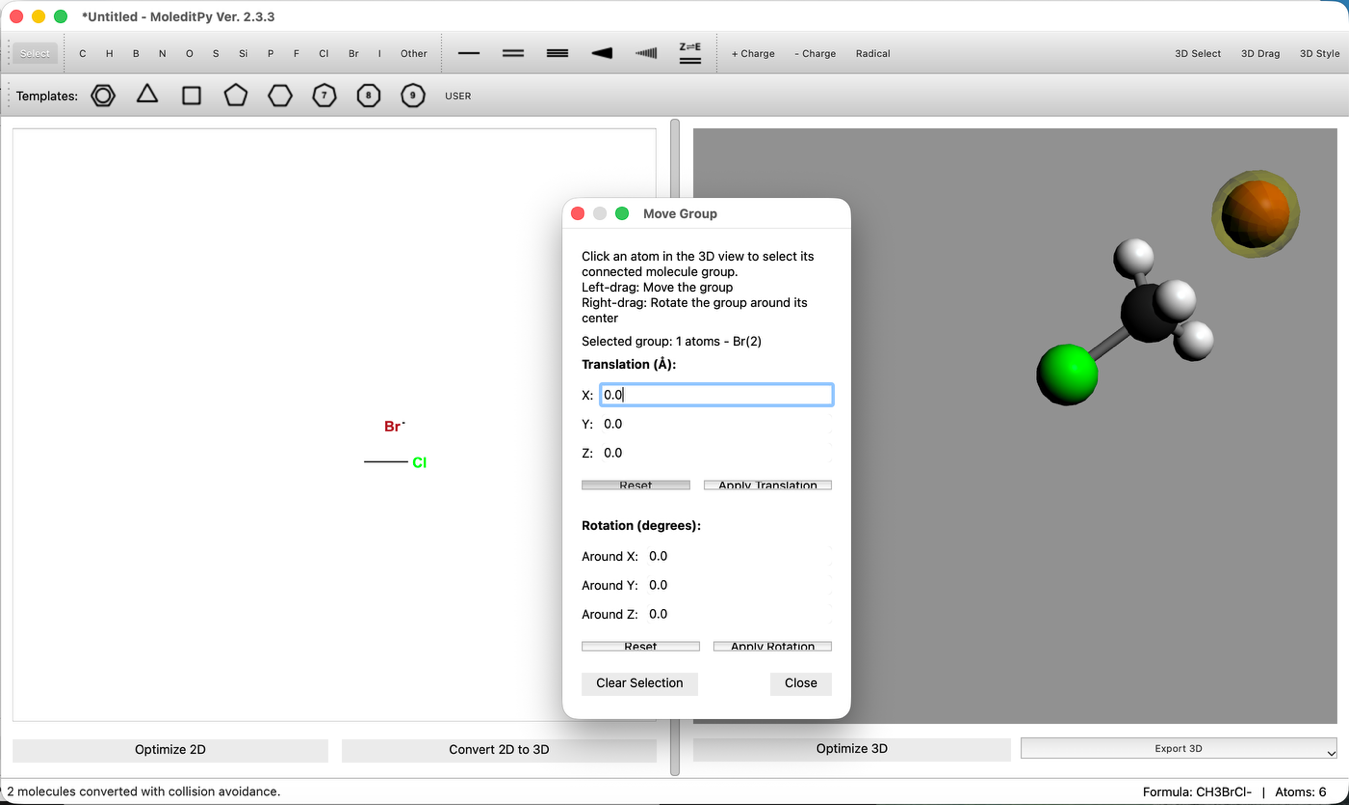
- Position Adjustment:
- Use the "3D Edit > Move Group..." tool to place Br- on the backside attack position of the carbon atom (opposite to Cl).
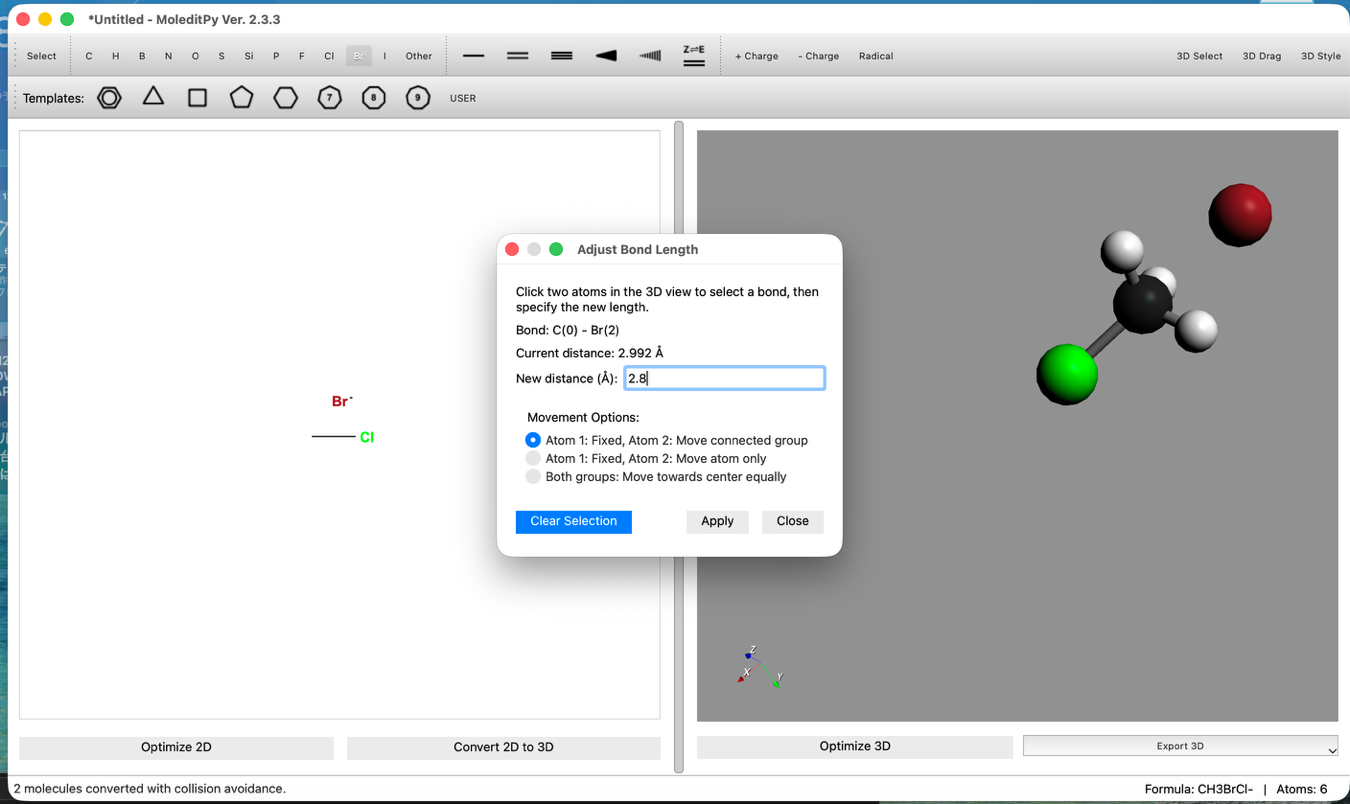
- Bond Distance Adjustment:
- Use the "3D Edit > Adjust Bond Length..." tool to set the C-Br distance to 2.8 Å.
Step 2: Relaxed Scan Calculation
- Launch PySCF Calculator:
- Open Extensions > PySCF Calculator.
- Scan Configuration:
- Set Mode to Relaxed Surface Scan.
- Click the "Configure Scan" button and set the Distance tab as follows:
- Start: 2.8 Å
- End: 1.96 Å
- Steps: 5
- This setting calculates the process of Br approaching C.
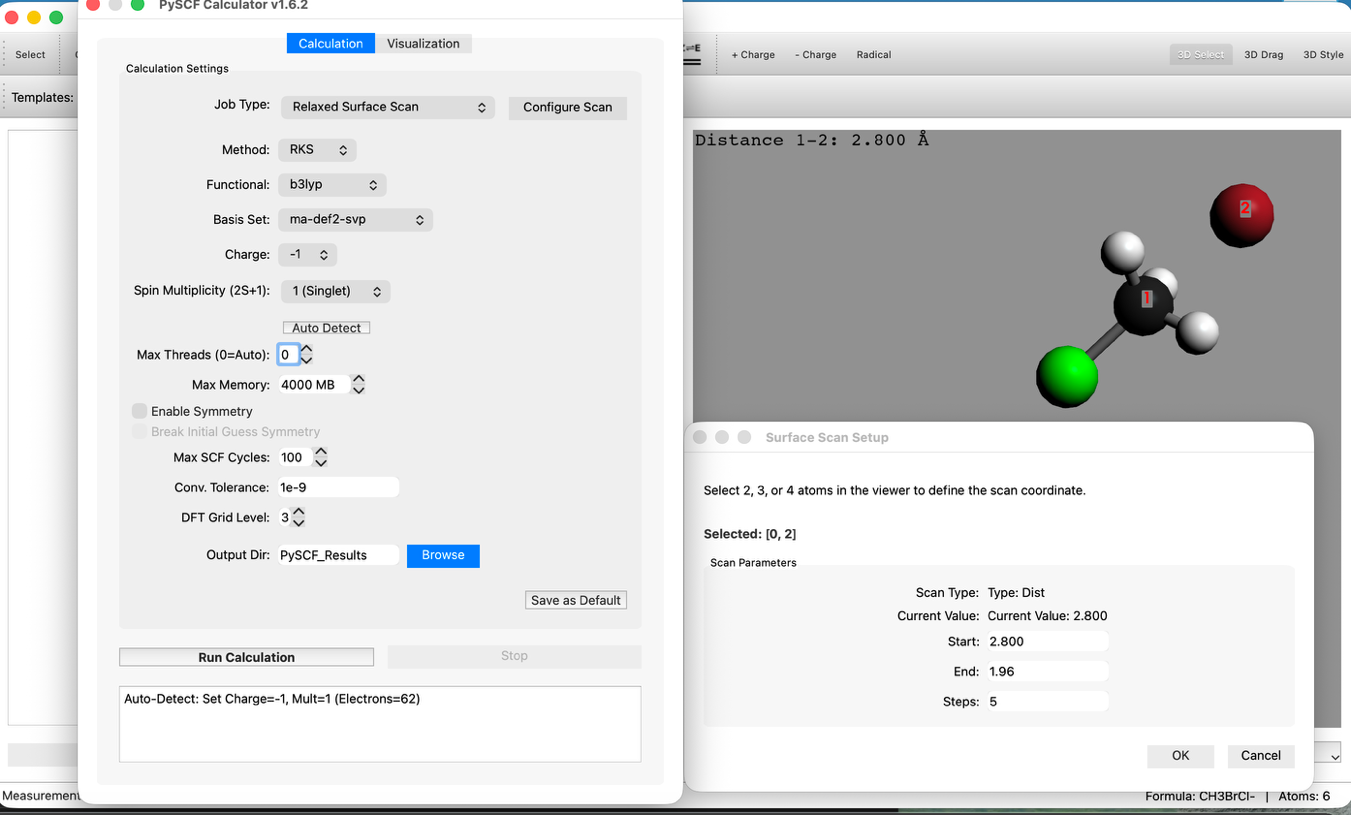
- Level of Theory Settings:
- Method: RKS (B3LYP)
- Basis: ma-def2-svp
- Note: For anion calculations, basis sets containing diffuse functions (like ma-def2-svp) are recommended. It takes longer than STO-3G.
- Run Calculation: Click "Run Calculation". Please wait as it takes some time.
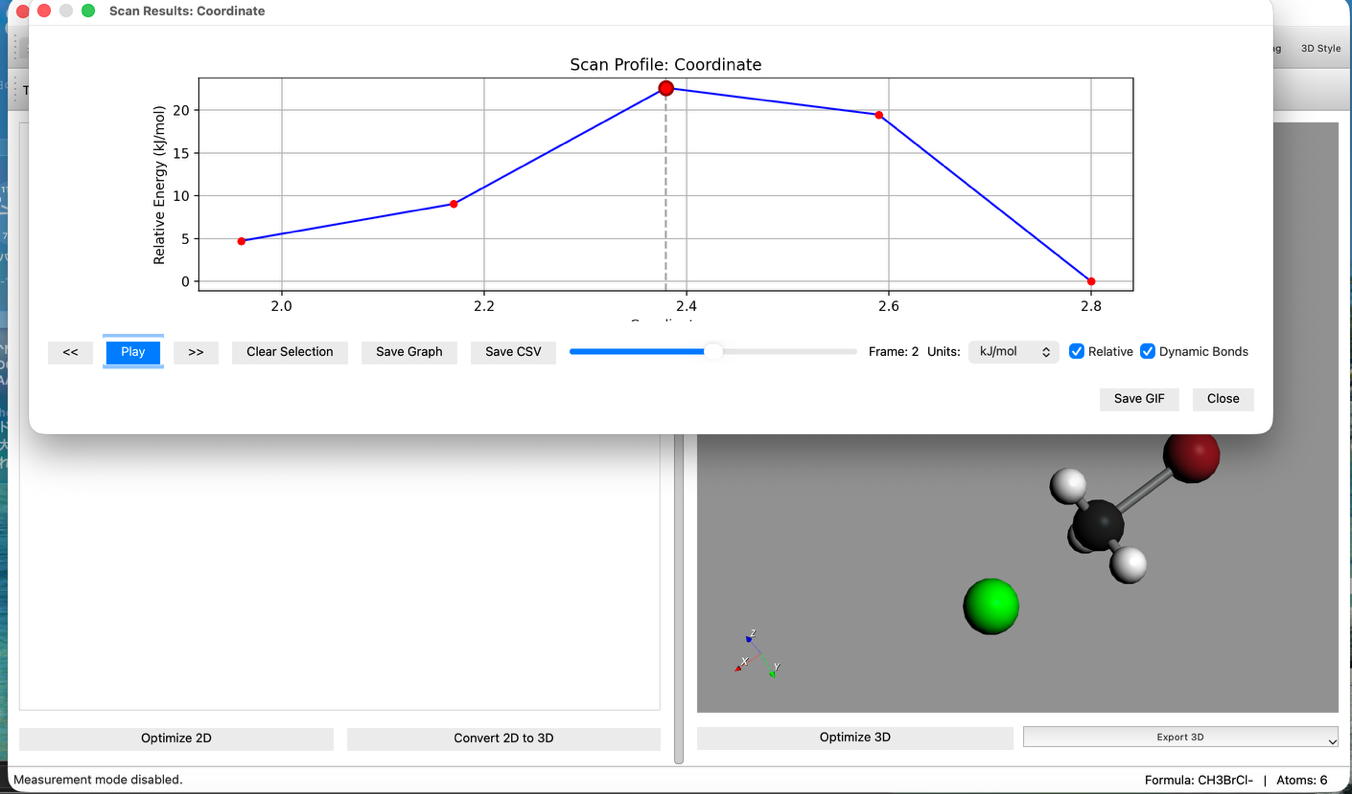
Step 3: Energy Diagram and TS Estimation
- Check Results:
- After calculation finishes, check the Energy Diagram. An energy barrier (mountain-shaped graph) should be displayed.
- Press the animation play button to see the reaction process.
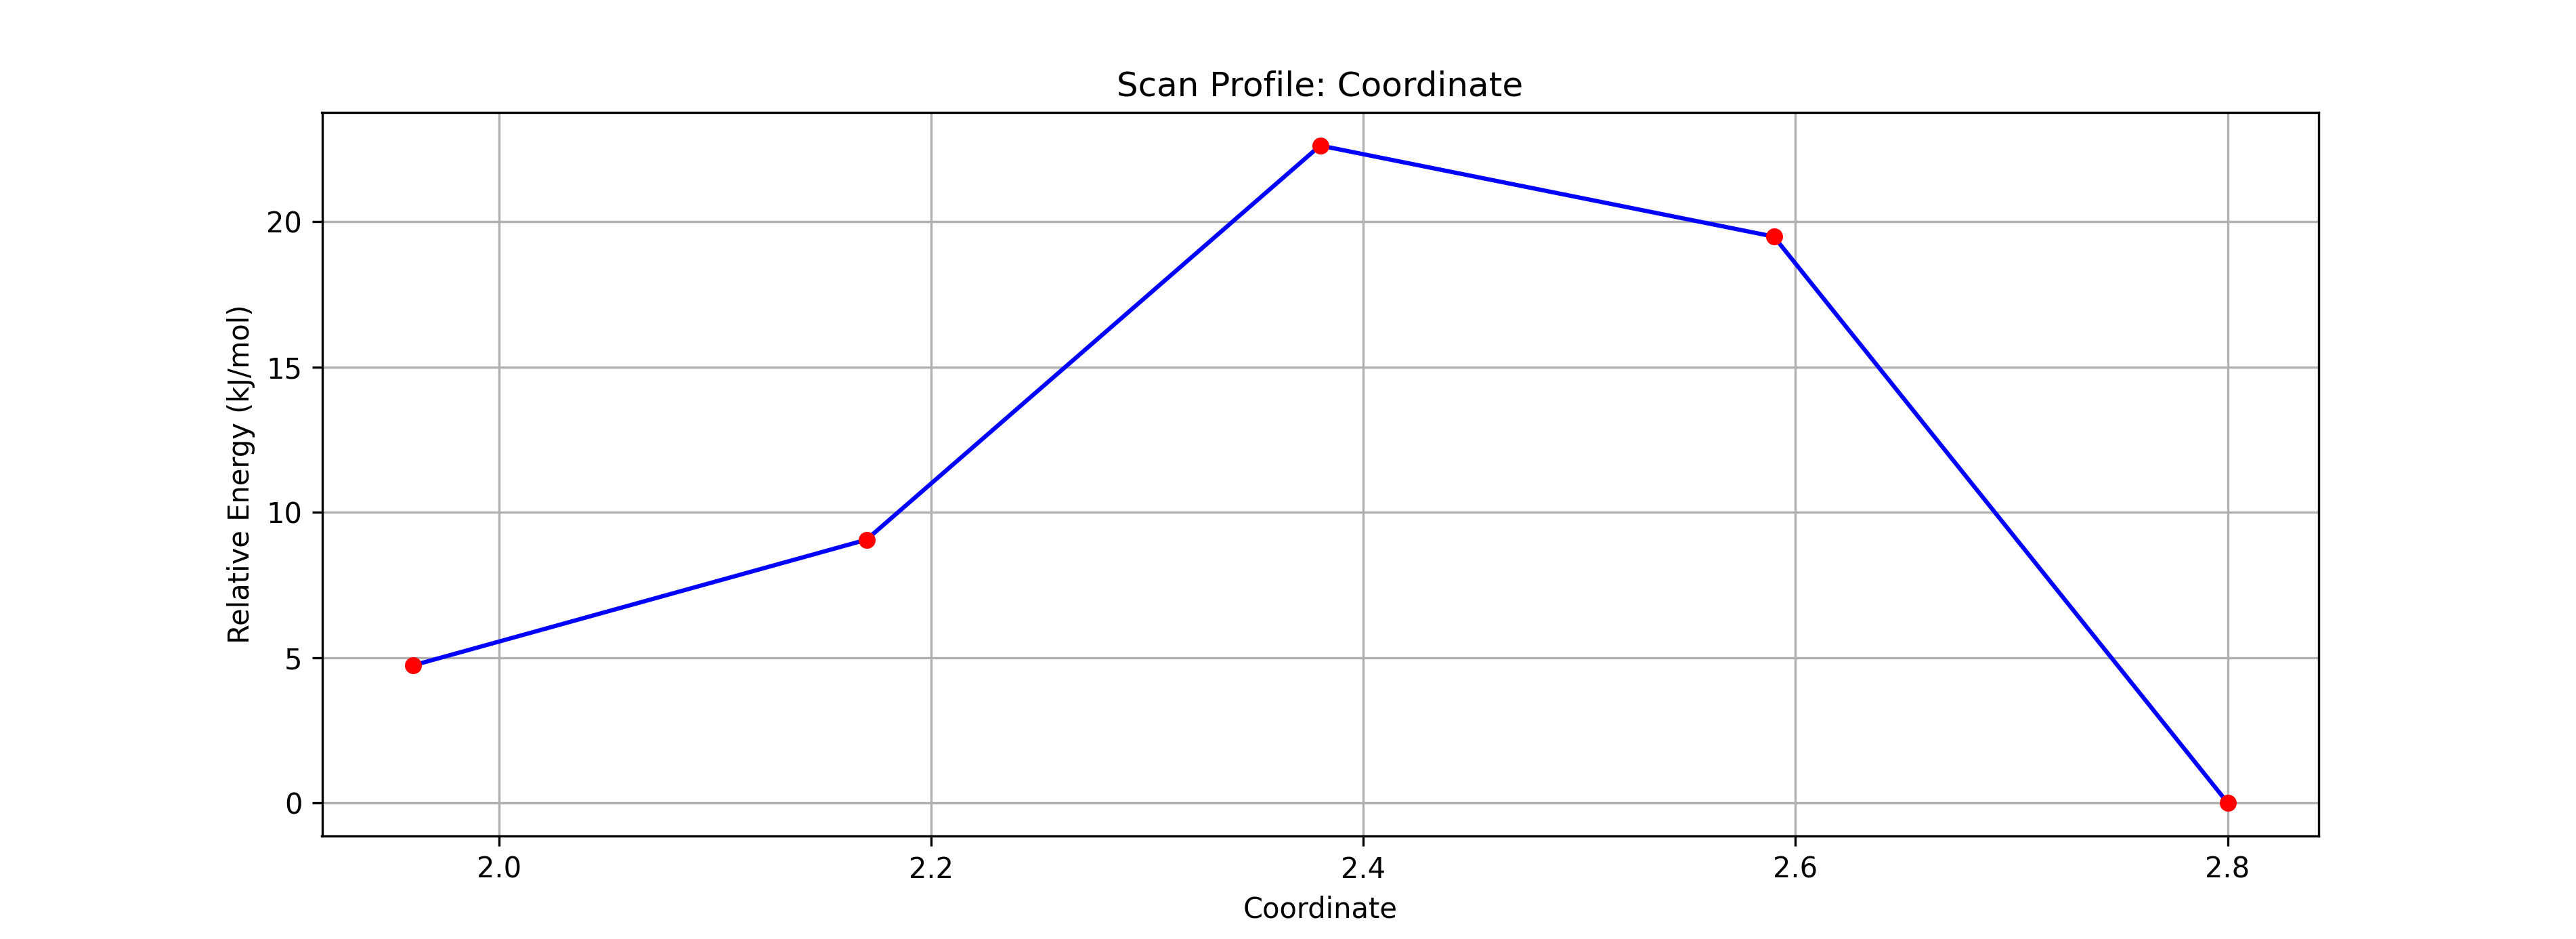
- Select TS Candidate:
- Click the Highest Point on the graph.
- This reflects the structure of that step in the main window. This serves as a good initial structure for the Transition State (TS).
Step 4: Transition State (TS) Calculation + Freq
- Change Calculation Settings:
- Return to the Calculation tab.
- Change Job Type to
TS Optimization + Frequency. - Do not change other settings (B3LYP / ma-def2-svp).
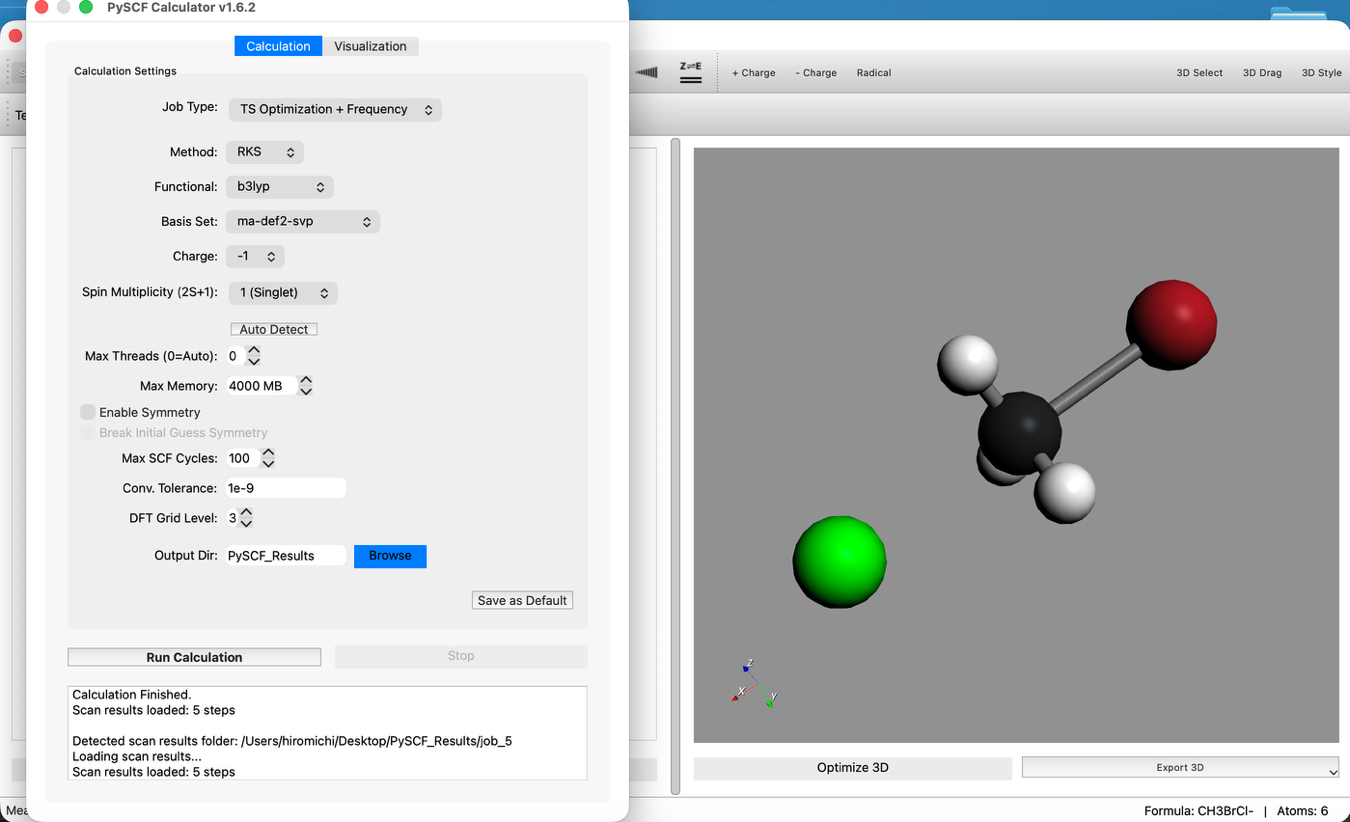
- Run Calculation: Click "Run Calculation" again.
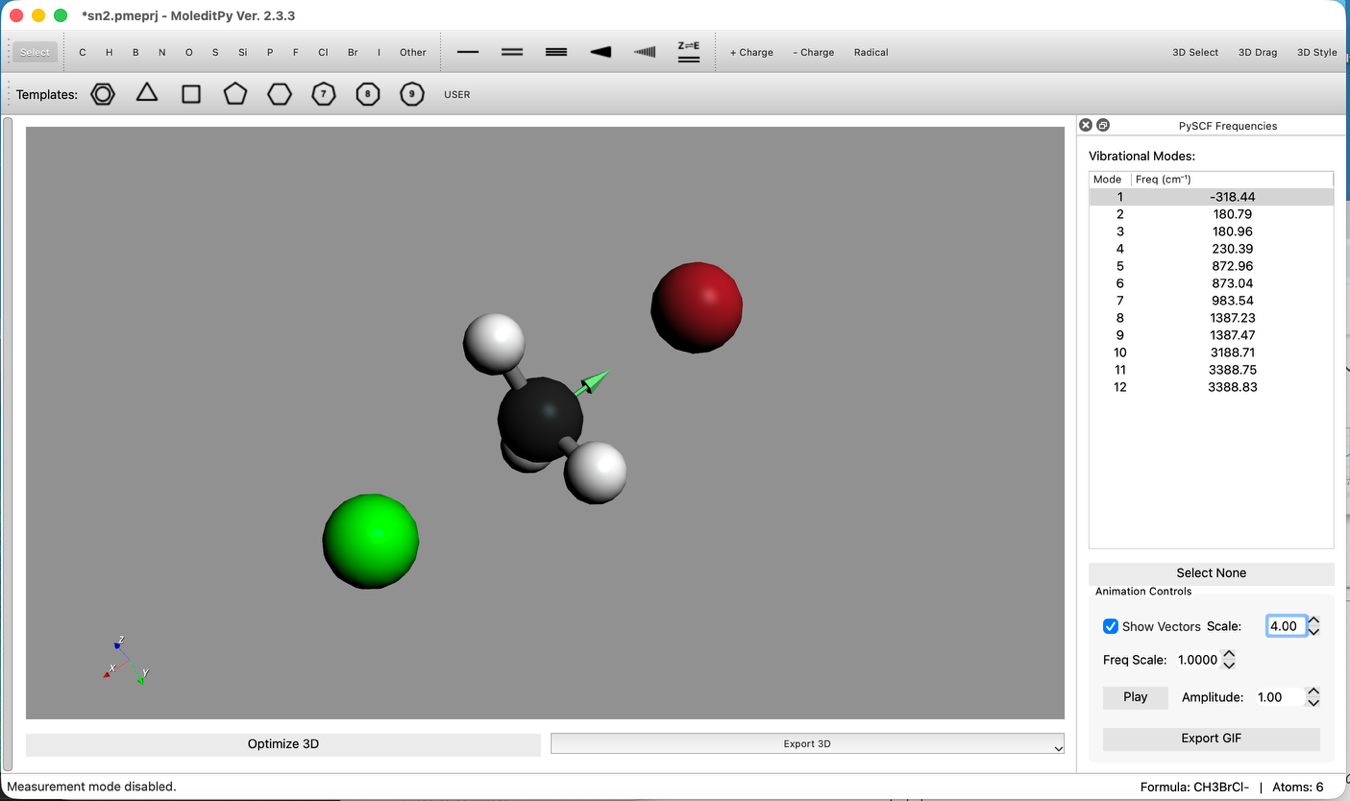
Step 5: Confirm Imaginary Frequency
- Check Vibrational Modes:
- After calculation completion, check the Vibrational Modes list.
- Confirm that there is exactly one Imaginary Frequency (negative frequency). This indicates a transition state.
- Select that mode and confirm via animation that atoms are moving along the reaction coordinate.
Calculation of Activation Energy:
Comparison of energy is required for calculating the activation energy.(Note: 1 Hartree ≈ 627.5 kcal/mol)
- Ereactants: Sum of energies of isolated Chloromethane (CH3Cl) and Bromide ion (Br-).
- ETS: Energy of the Transition State obtained in Step 4.
- Activation Energy (Ea):
Ea = ETS - Ereactants
(Note: Since the calculation is performed in a vacuum, the profile becomes a double-well type. Also, the transition state might be more stable than the reactants.)